3 The Transmembrane Domain Remains Elusive
One of the long-standing goals of our lab is to solve the structure of the ENaC TMD. Such a structure would provide valuable insight into the source of ENaC’s spectacular selectivity for sodium over potassium. It would also inform our view on the similarities and differences between ENaC and ASIC, such as whether ENaC also has an HG-motif, whether ENaC’s gating mechanism follows that of ASIC, and what conformational changes cause sodium self-inhibition.
Unfortunately, that goal will stand a while longer. None of my maps produce TMD density with resolutions better than 6 Å, and few of them even reach that threshold. Additionally, no map has density for all six transmembrane helices (TMs). Finally, and most damning, the arrangement of the TMs we do see is not consistent with what is known about their arrangement around the pore. We must conclude that the TMD of my maps is significantly disrupted, and analysis of these results will not bear fruit. I reproduce them in the first section of this chapter in case they are ever of interest. Perhaps of more value will be the following sections in which I cover experiments that produced no valuable results so that future researchers do not retread the same ground.
3.1 Constructs
To tackle the problem of the ENaC TMD, I solved the structure of six different combinations of condition and construct. These conditions are summarized in Table A.1, but I will present them in greater detail here, along with their models. In addition to the mutations I discuss here, all human constructs had the canonical furin sites knocked out: αR178A, R204A and γR138A. It was our hope that knocking out furin sites would lead to a more defined ECD composition by preventing our expression system from cleaving the ECD.
It is important to note that the described mutations were only applied to the human constructs we discuss. All mouse models are wild-type (with the exception of a few residues left from cleavage of GFP off the γ subunit).
3.1.1 Cysteine Knock-Out
The cysteine knock-out (CKO) mutant had four C→A mutations: αC63A, βC30A, and γC33A,C41A (Figure 3.1). We mutated these positions because some (but not all) intracellular cysteine residues are known to be palmitoylated1–3.
We wondered if previous difficulty in solving the structure of the TMD may have been the result of aberrant palmitoylation, given that ENaC in our expression system exists at far higher concentration than would exist in a typical cell. CKO mutants did indeed express at higher levels than WT, and their peaks on SEC appeared more homogeneous.
3.1.2 DEG
The DEG mutation replaces serine 520 in human ENaC with the equivalent lysine from C. elegans’s DEG channel. This mutation keeps the channel in an open state regardless of whether the GRIP domain is cleaved or not4. In channels to which we apply the DEG mutation, we also apply a mutation in the GRIP domain which reduces the affinity of the channel for its inhibitory peptide, αT240W5.
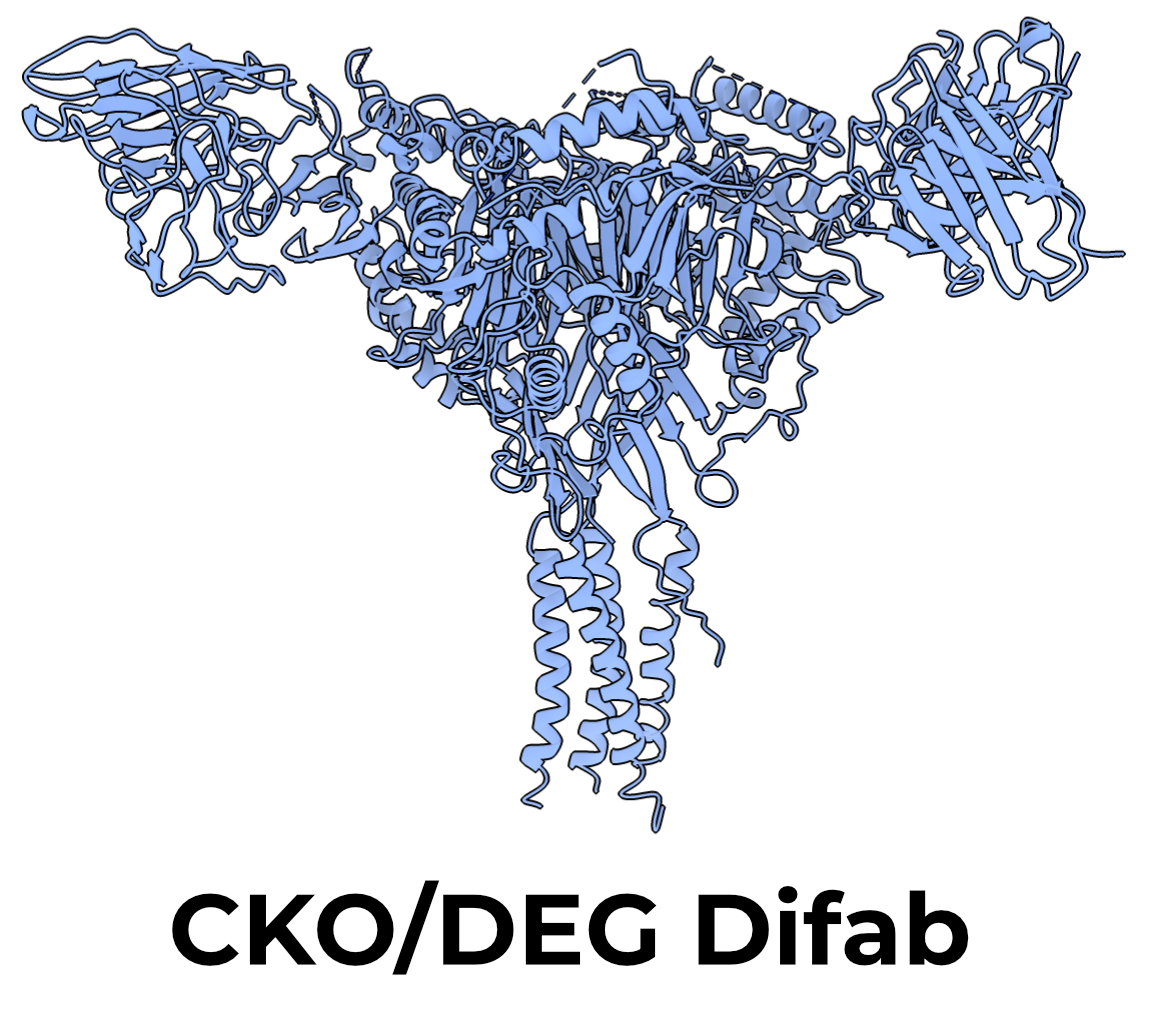
The DEG and GRIP mutations were applied to a background of human CKO channels. We thus call these channels, which we expect to be constitutively open, CKO/DEG channels (Figure 3.2).
3.1.3 Acid-shock
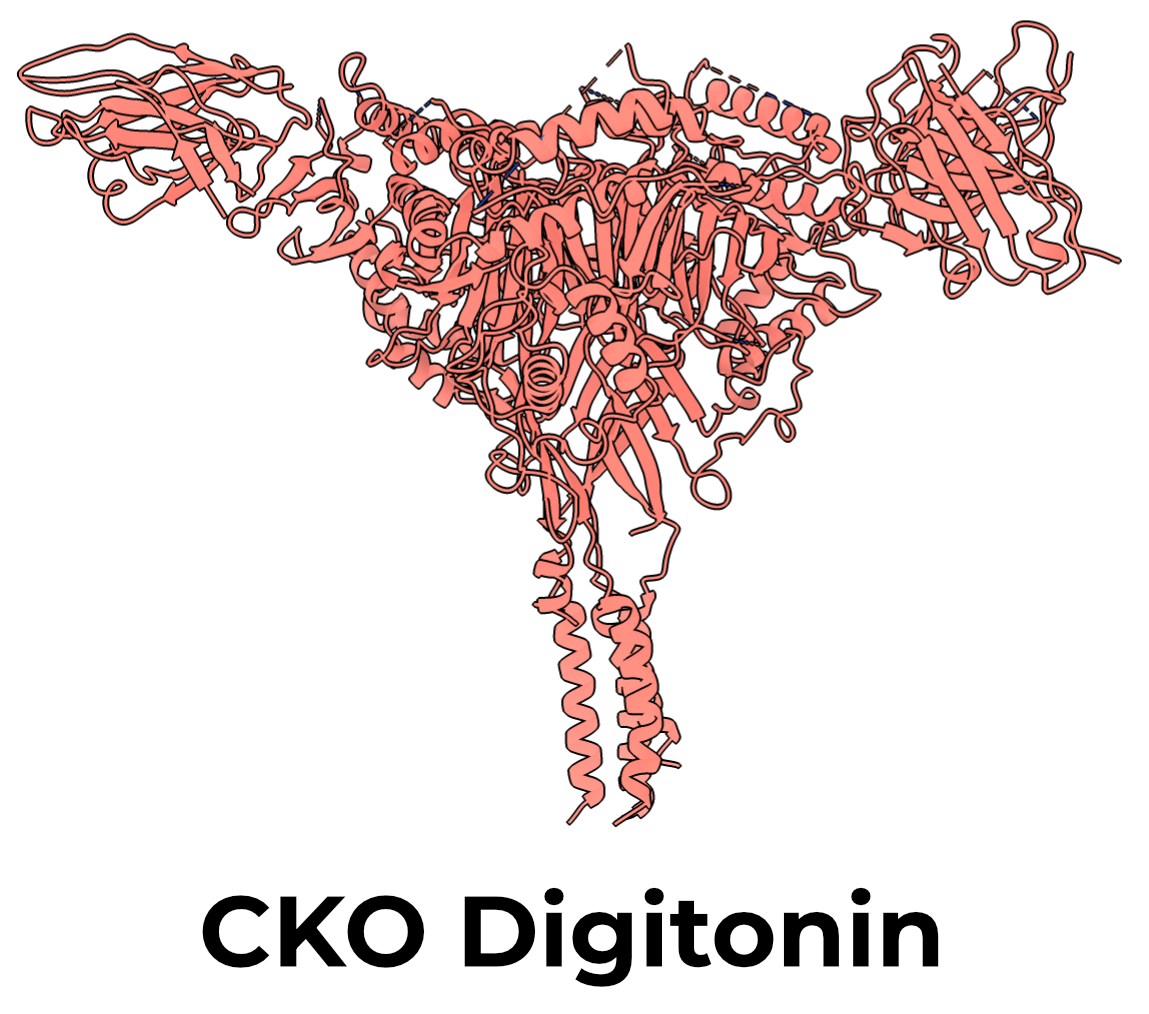
For two maps (CKO digitonin and CKO/DEG difab), I briefly “shocked” the material by desalting it into a pH 6.0 solution (as opposed to our typical purification pH of 7.4). I did this to test if poorly-folded material from internal membranes might be more susceptible to cashing out in less-favored conditions. I did not end up detecting any difference in either the final yield, the yield before and after acid-shock, or the map quality. I therefore discontinued this practice after these two maps.
3.1.4 PIP2
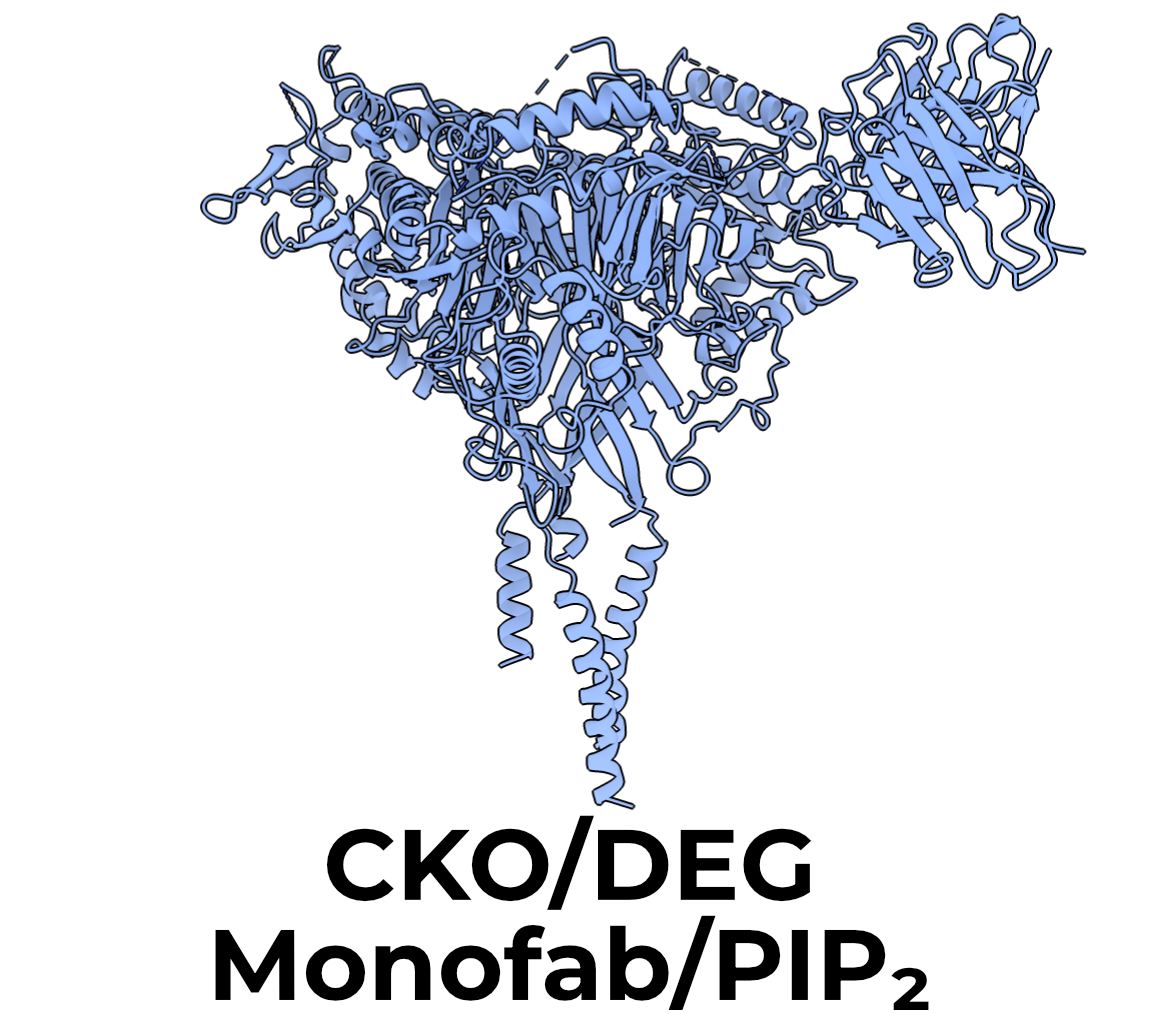
As discussed in Section 2.4.2.1, ENaC requires PIP2 to open. I thus added 1 mM C8 PIP2 to the CKO/DEG monofab samples just before grid preparation (Figure 3.3). I did not notice any difference in TMD quality or conformation compared with the CKO/DEG difab map (which did not have PIP2 added), and so did not add the lipid to any other preparations in this work.
3.1.5 Nanodiscs
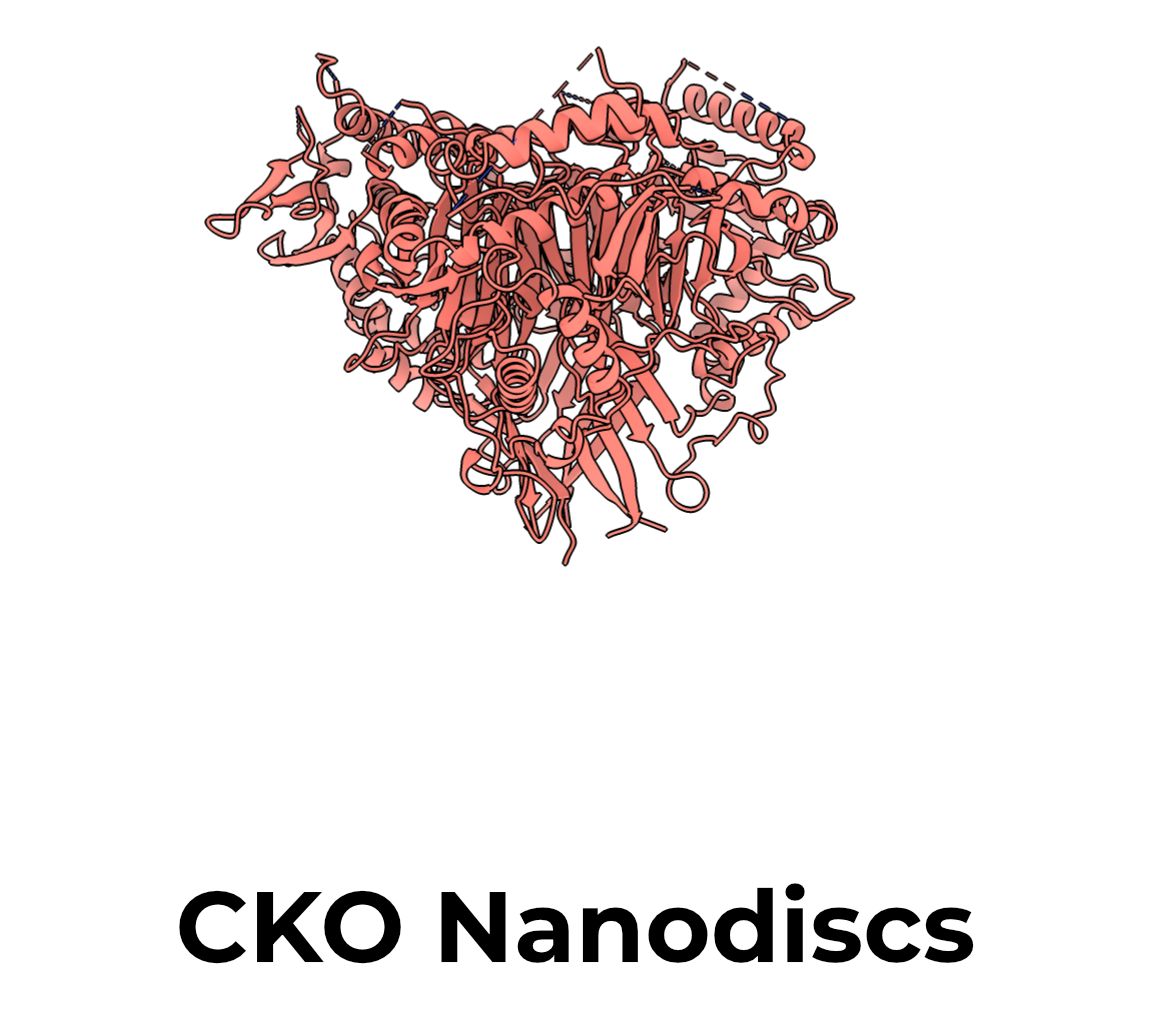
ENaC seems to interact significantly with the membrane (Section 2.4.2). I thus wondered if making grids with protein in lipids, as opposed to detergent, might improve the map quality. I thus solved a map of CKO protein in nanodiscs composed of POPC to test this hypothesis (Figure 3.4).
This map had the worst TMD density of any of the conditions I tested. My nanodisc prep had very low yields (approximately 5%), and so there may be some issue that causes the material to unfold during nanodisc reconstitution. Another possibility is that the nanodisc is more ordered than a micelle, and so dominates the alignment of the TMD, blurring out TM helices.
It is possible that other lipid combinations or reconstitution pipelines might improve results. This could be a promising avenue for future research, but I did not pursue that here.
We had also been concerned that our use of Fabs might make it difficult or impossible to align our particles to the TMD, or that they may be changing the conformation of the ECD in some way. This protein preparation therefore did not include either of the fabs we use to break pseudosymmetry. Using the extensive ECD glycosylation I was still able to break pseudosymmetry, but did not detect any differences with and without Fabs (discussed more in Chapter 4).
3.1.6 Mouse ENaC and trypsin
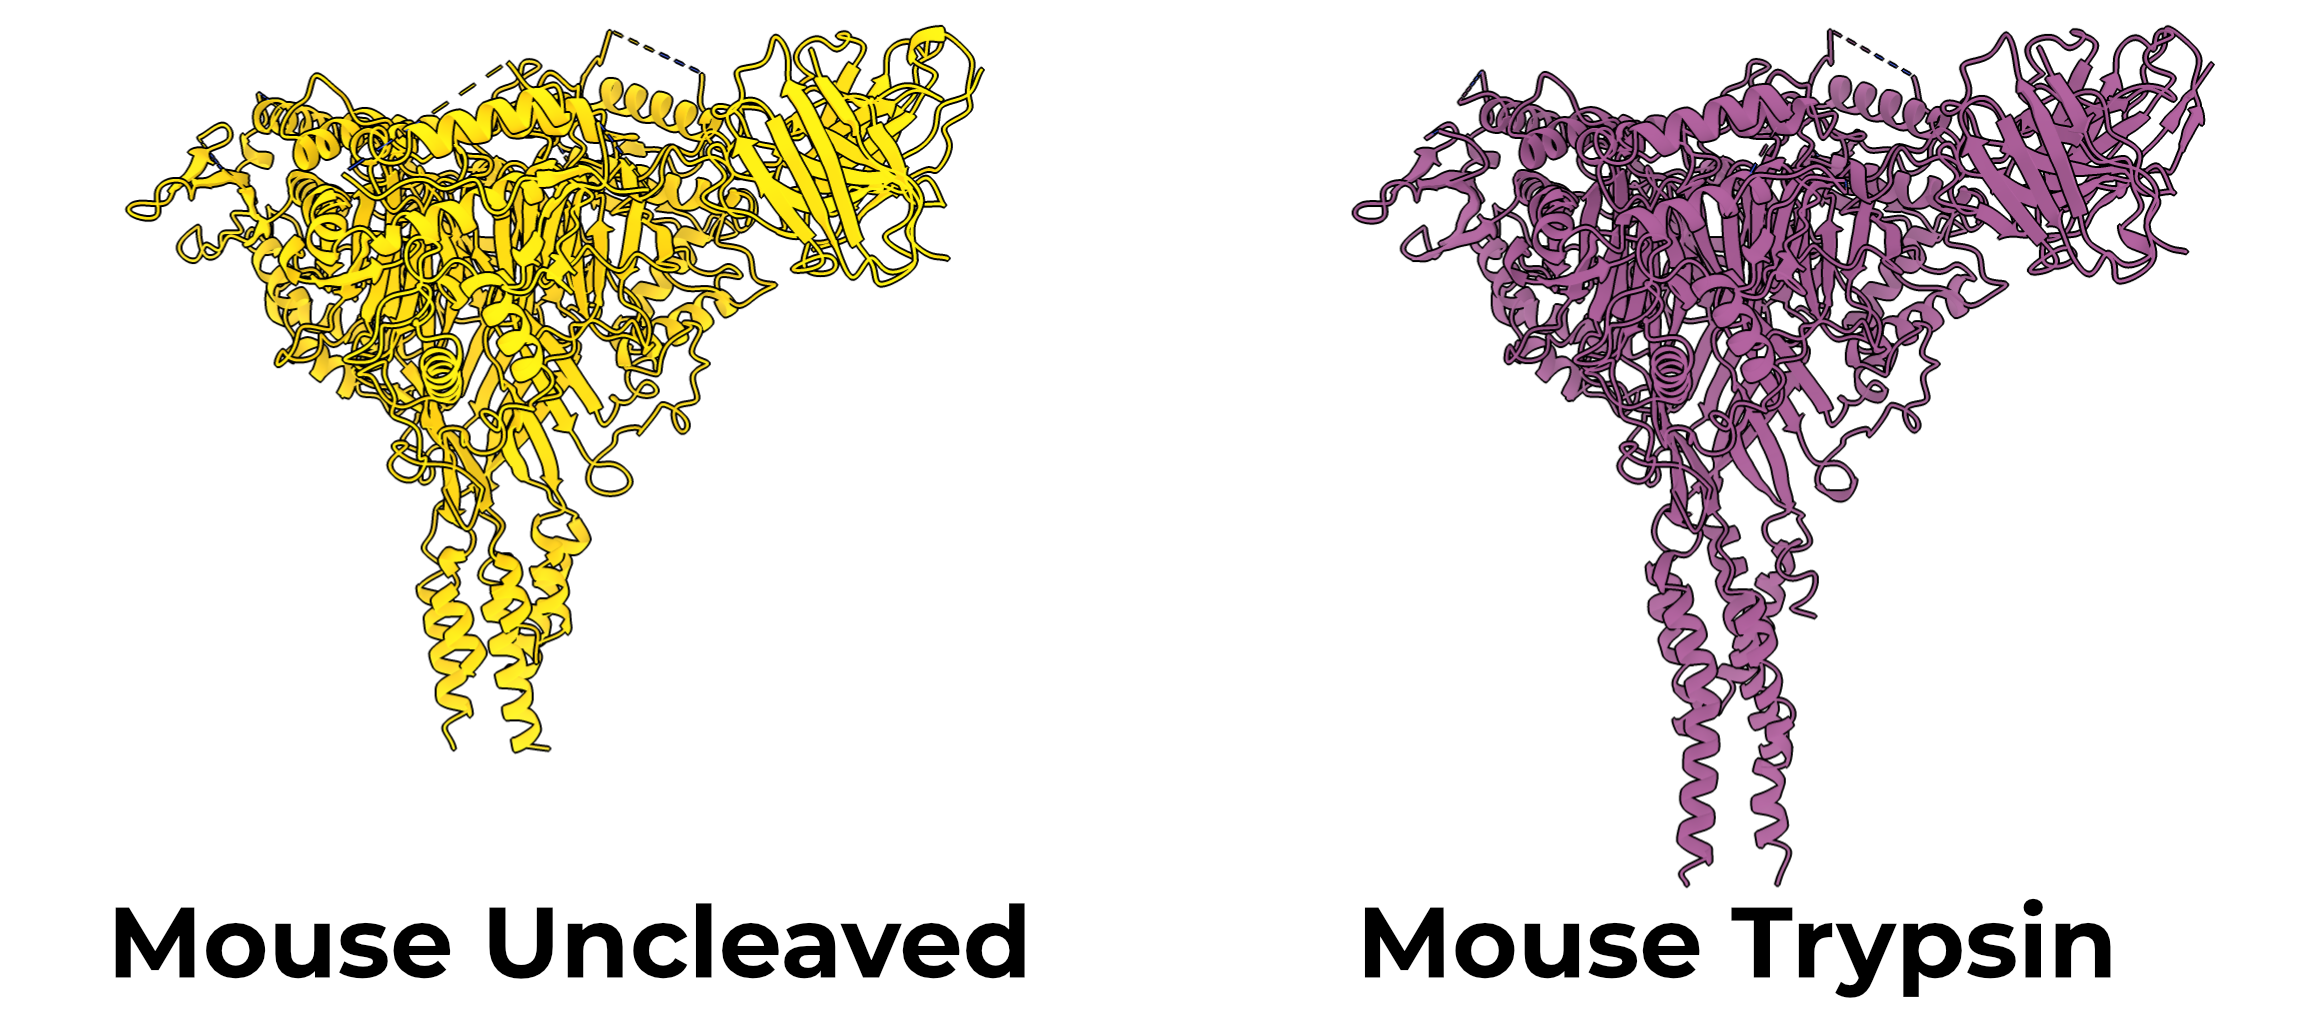
Finally, I investigated another homologue, mouse ENaC (Figure 3.5). Like human ENaC, mouse ENaC is an αβγ heterotrimer. This material was treated in largely the same way as human ENaC, and the results are presented together.
I treated one of the two mouse maps presented here with trypsin. We expected this to induce a conformational change from the closed to open states, but did not see any significant difference in the ECD or TMD. This is discussed further in Chapter 4.
3.2 The TMD is misfolded
Our previous structural work was focused on wild-type-like channels, with undefined gating states6. I wondered if channels with a defined open state might provide a more consistent, and therefore higher resolution, TMD. To this end, I created mutant channels (CKO/DEG) which contained two mutations expected to increase channel PO. The first, βS520K, holds the channel open regardless of proteolytic cleavage state4. The second, αT240W, which reduces the affinity of the channel for the α inhibitory peptide5. I solved maps of the CKO/DEG channels with and without C8 PIP2, a ligand known to open ENaC without proteolysis7.
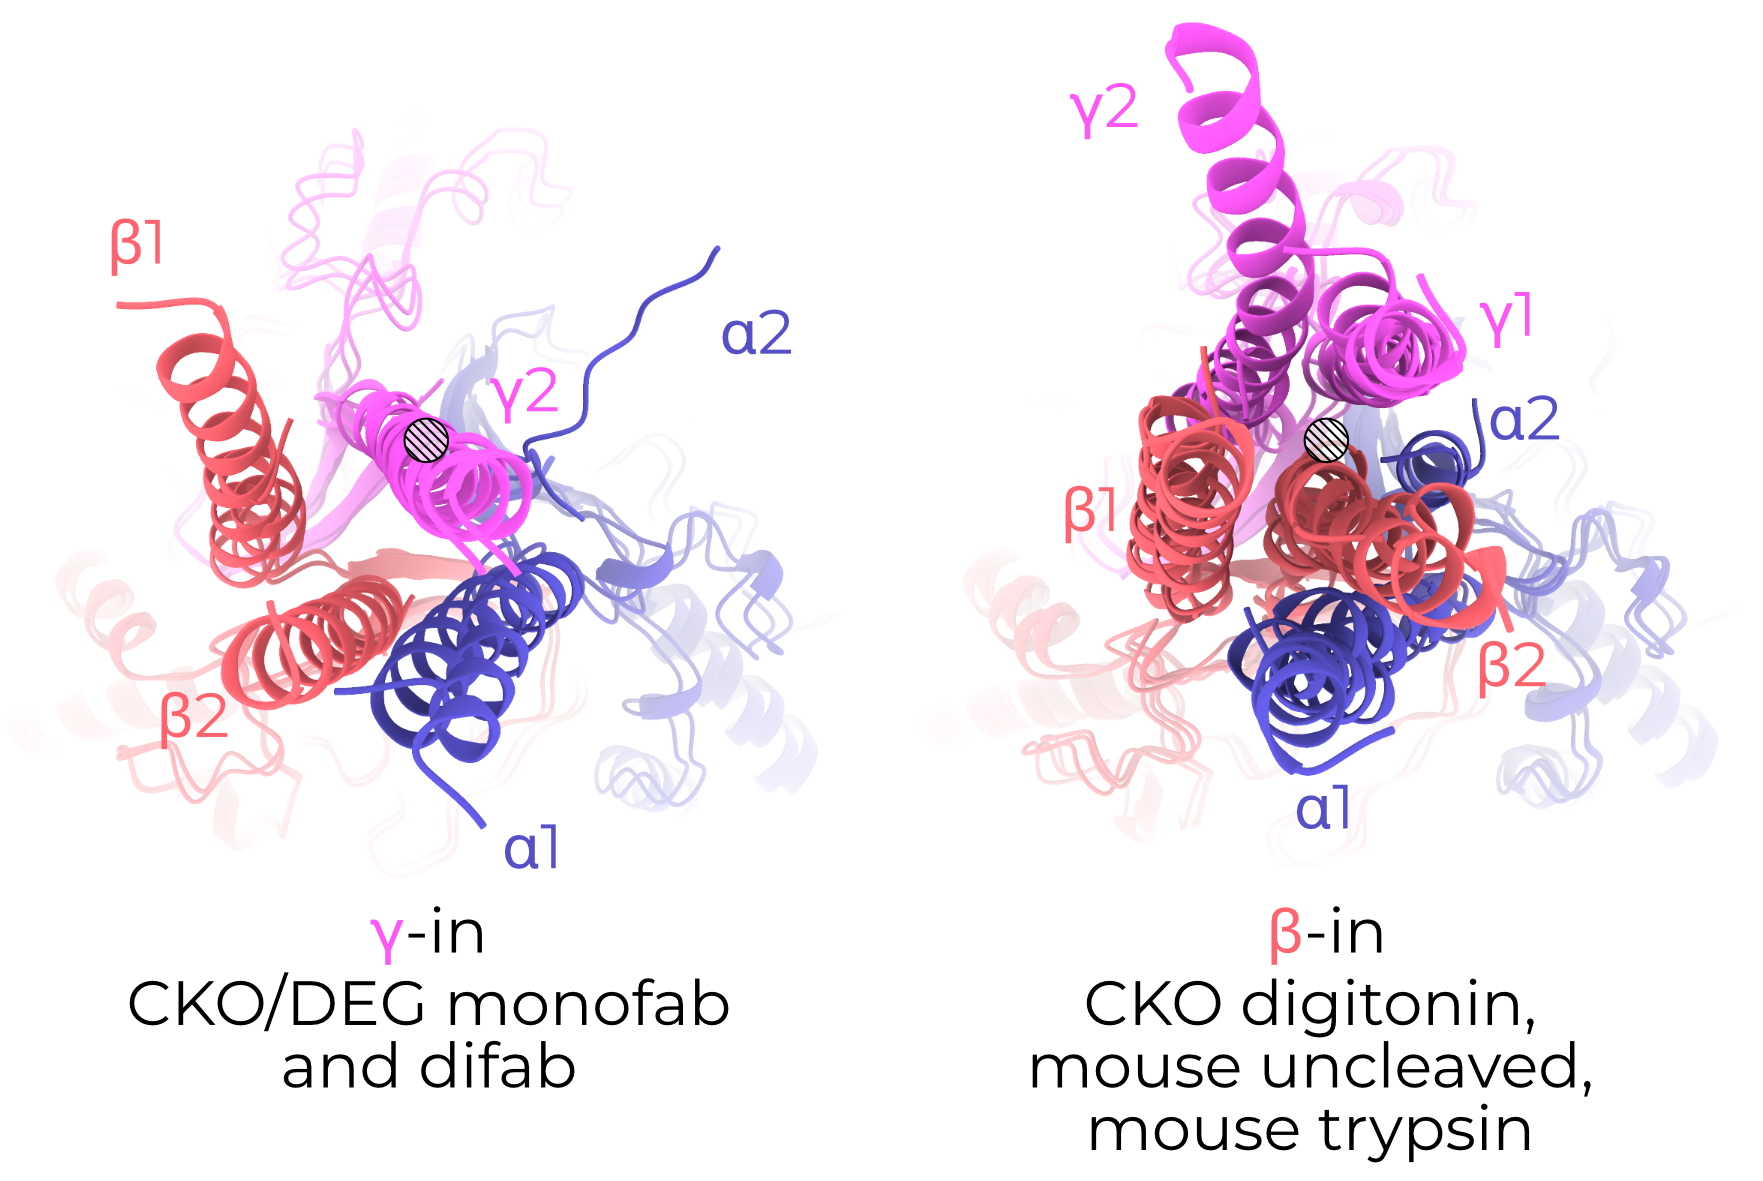
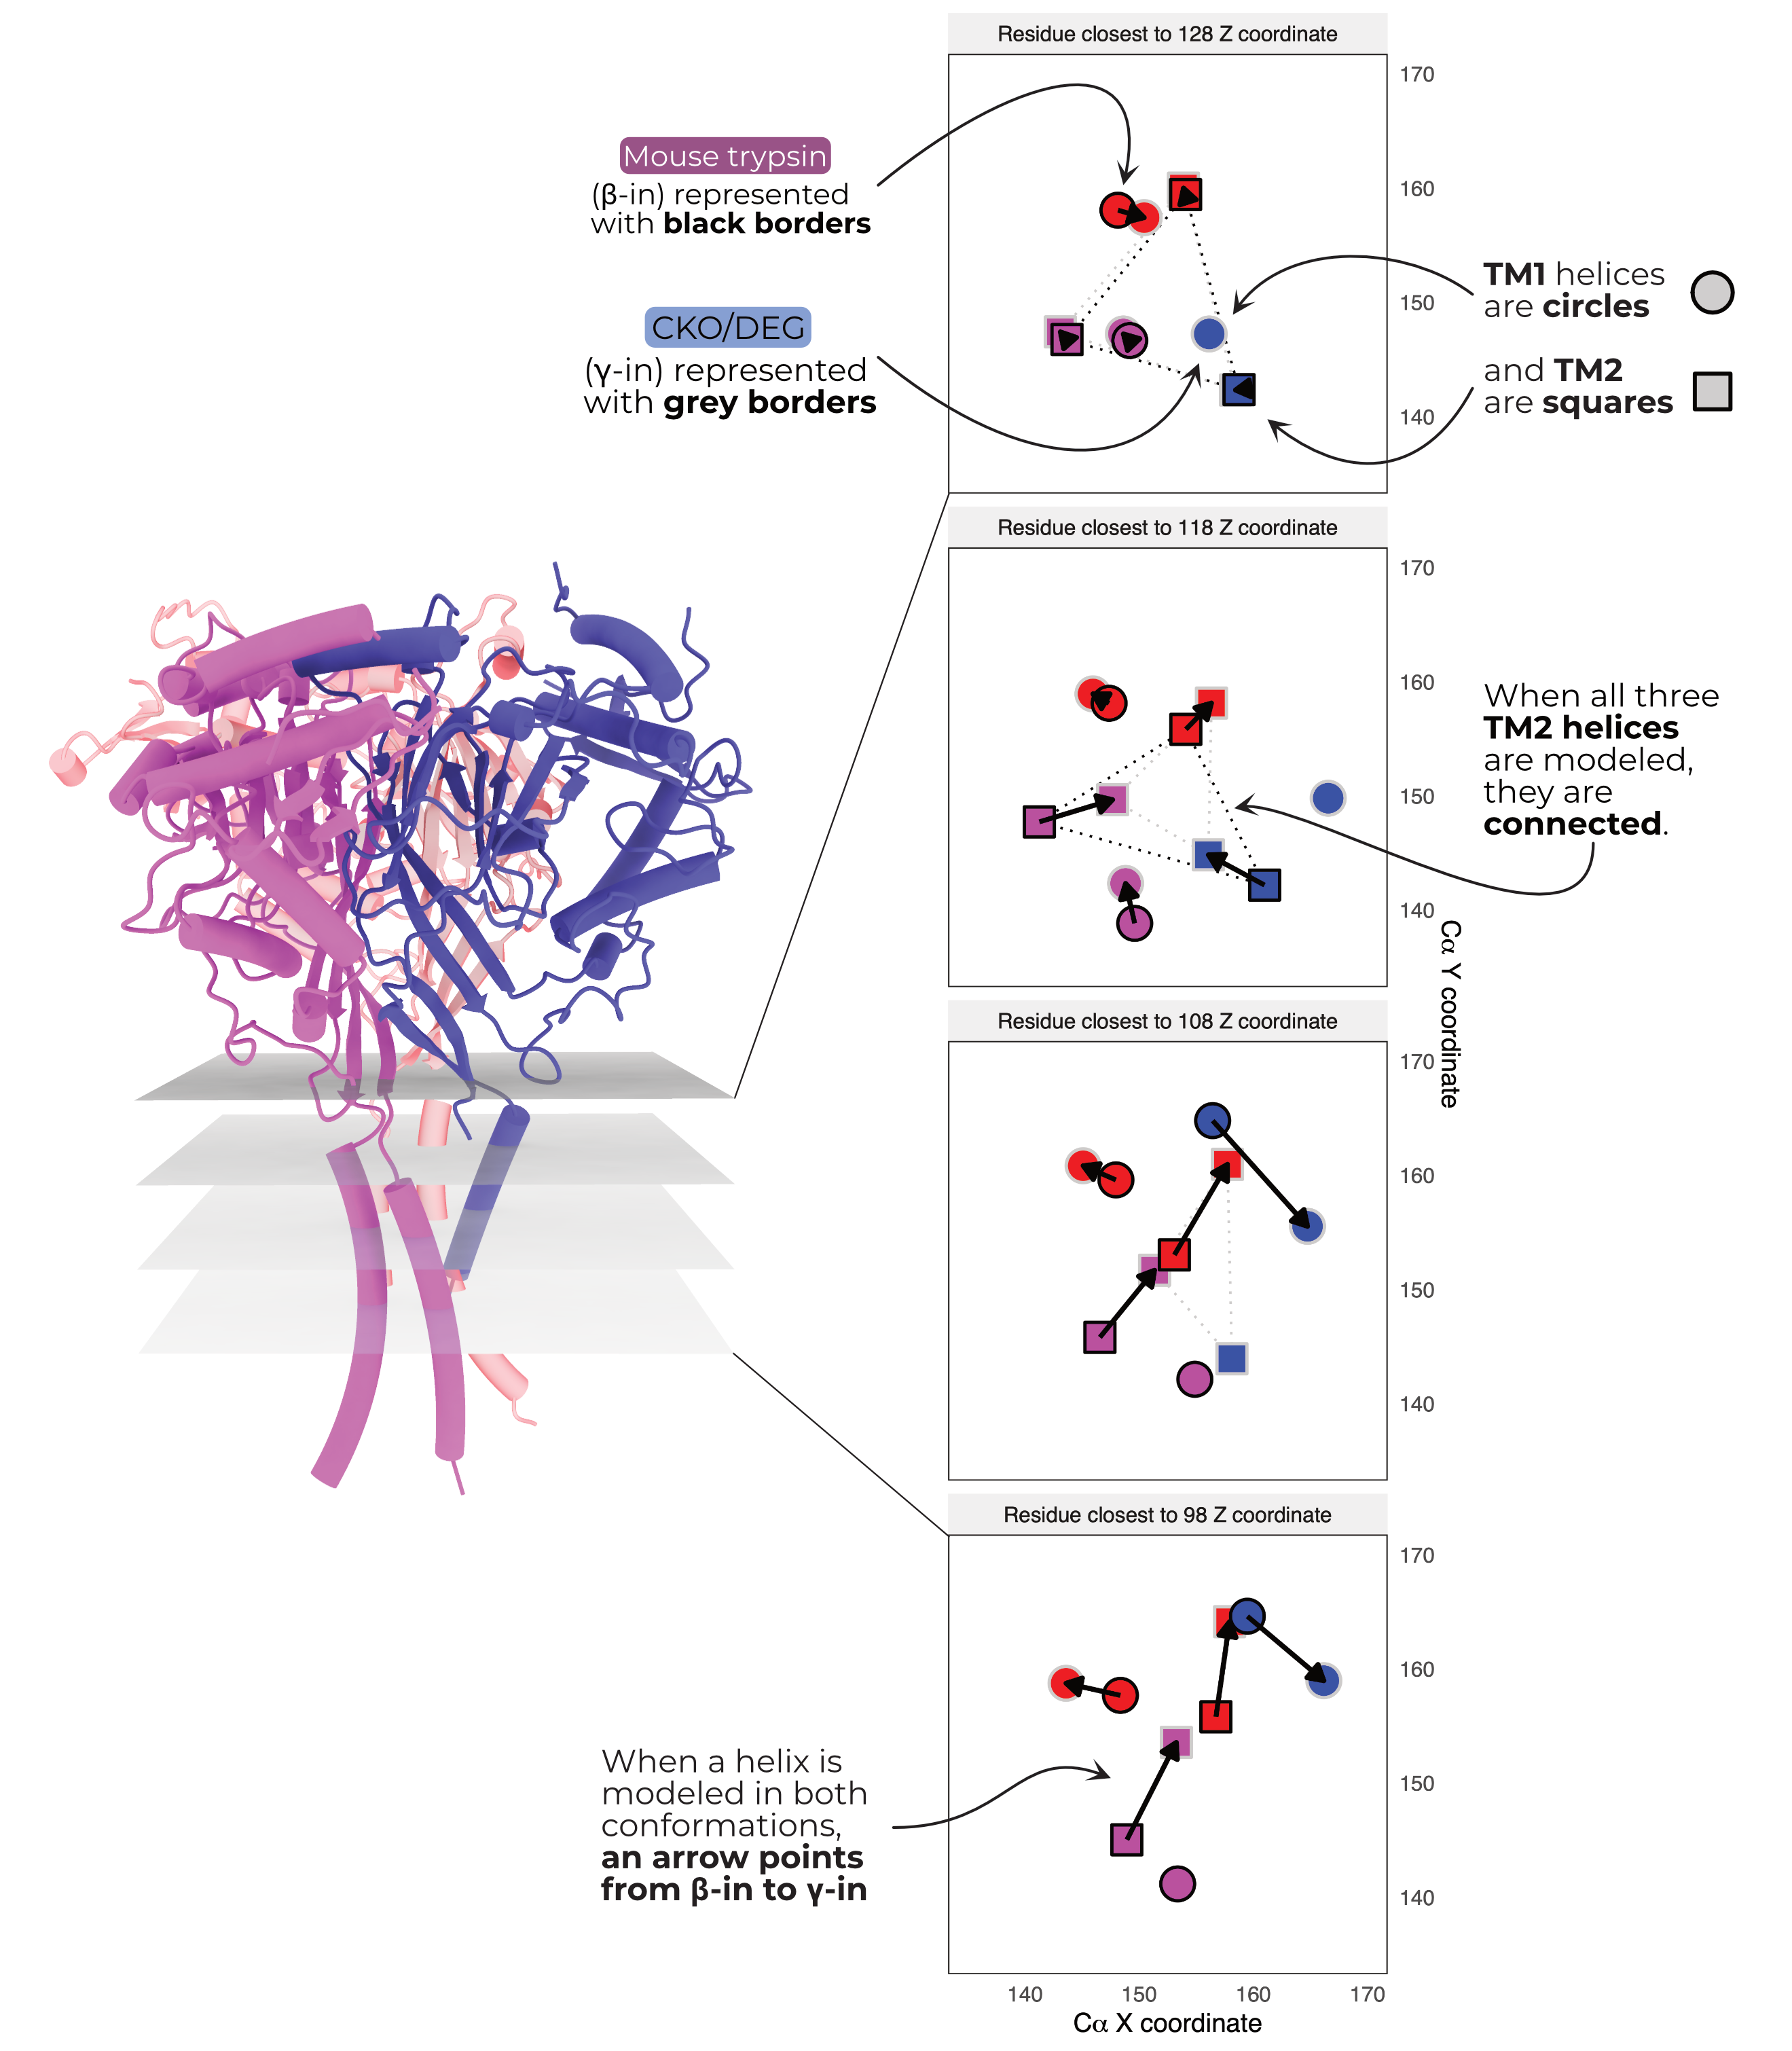
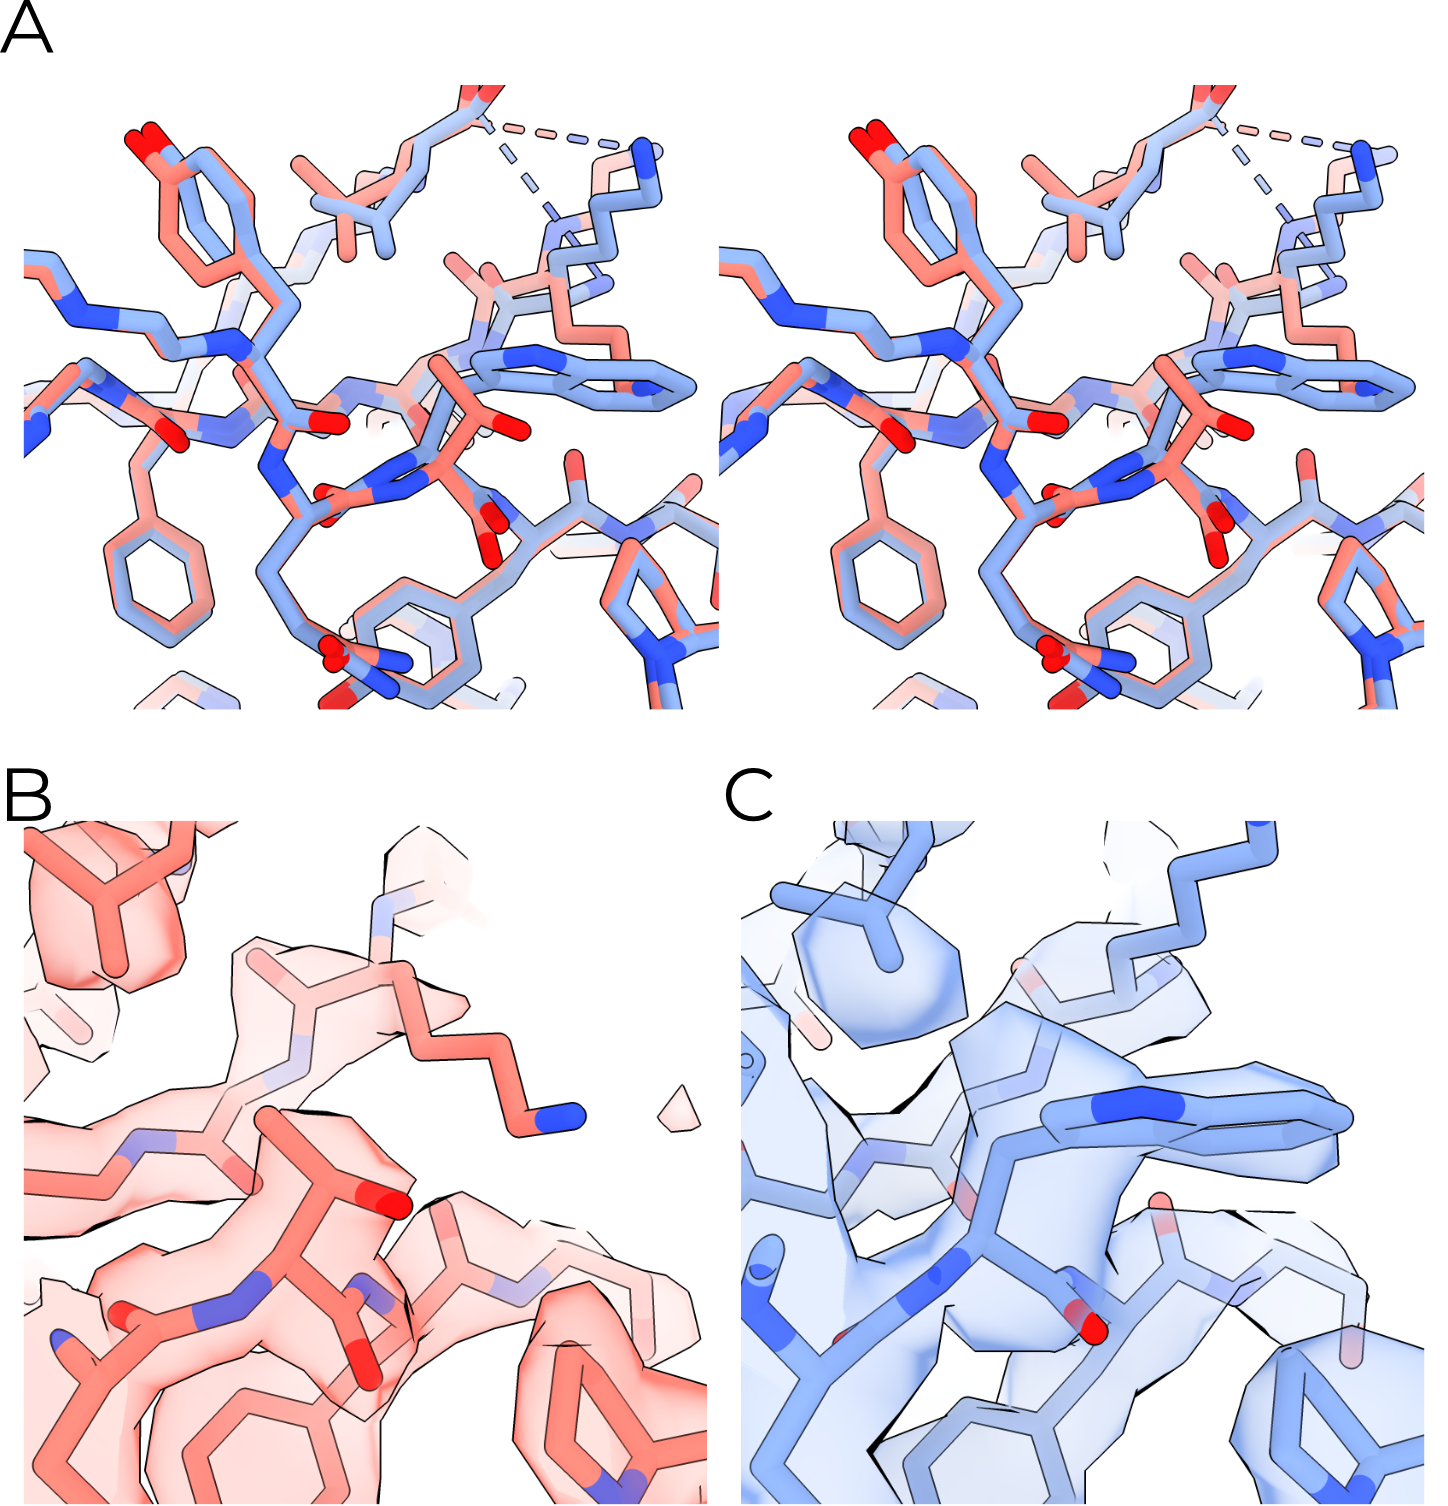
In all six of our models, the visible TMs are arranged in a roughly triangular fashion around a central helix (Figure 3.6 A). In CKO/DEG channels this helix is γ TM2. In all other models, the central helix is β TM2. I thus name the two conformations γ-in or β-in, respectively. I observe no change in the TMD open addition of PIP2. Unfortunately, αTM2 and γTM1 are only visible in the β-in conformation. The arrangement of and great distance between pore-forming TM2 helices observed in our maps (Figure 3.7) also runs counter to existing knowledge of ENaC’s pore8. Given this surprising state and the low quality of the maps’ TMDs, I limit technical discussion of the TMD and hope that future studies will better resolve this critical channel domain. I do also note that although our cryoEM maps support the presence of the αT240W mutation, I observe no significant rearrangement of the nearby residues (Figure 3.8).
3.3 Functional Assays
I will cover my work on developing functional assays here, since they would be most useful in assessing the quality of purified ENaC’s TMD. For the most part, I worked on two functional assays: the scintillation proximity assay (SPA) and the flux assay. Much of the work I present on SPA was performed alongside Alex Houser and especially James Cahill.
3.3.1 The scintillation proximity assay does not show promise for ENaC/DEG family members
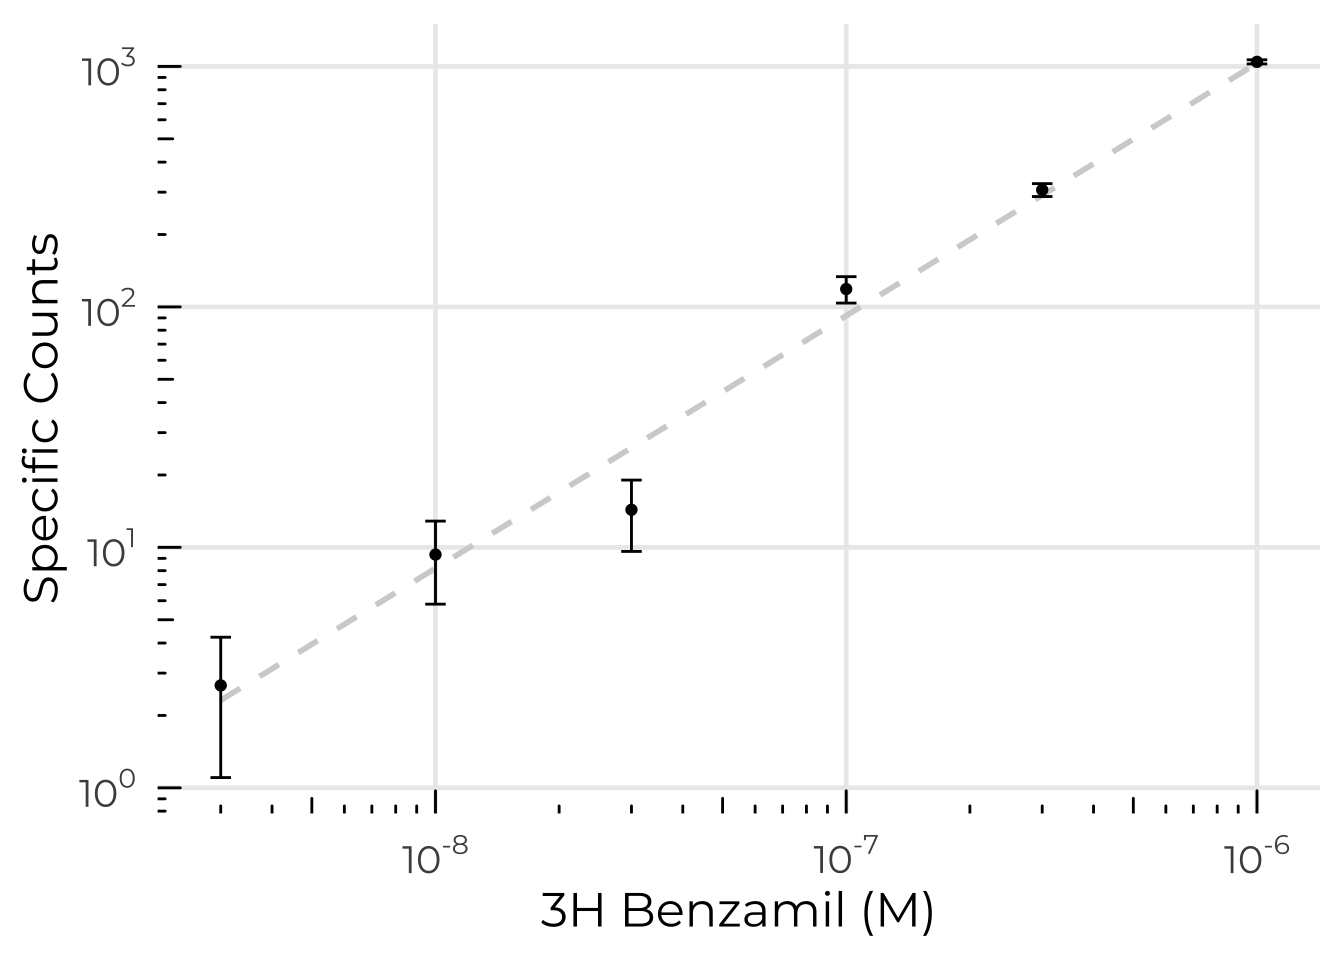
In a SPA assay, the protein of interest is bound to beads which contain a scintillant. Radiolabeled ligand is then added to the mixture. If the ligand binds the protein, it is close enough to the beads that the β-particles can interact with the scintillant, emitting light. These counts can be taken as a measurement of binding affinity. Some argue that measuring affinity for a pore-binding ligand is a proxy for measuring proper folding of the pore9.
Our main issue was non-specific binding. We could never measure the non-specific binding in its entirety, and so any signal that may potentially have been present was swamped out in noise. Changing from detergent sample to nanodiscs did not improve signal. Neither did changing from standard SPA beads to smaller, higher SNR nanoSPA beads.
One possible explanation of this is that none of our ENaC has a properly folded TMD and therefore cannot bind amiloride or its derivatives. Indeed, that is what our maps seem to suggest. However, experiments performed with human ASIC show the same result: ever-increasing linear “specific” counts no matter the conditions (James Cahill, personal communication). However, this same ASIC protein has properly folded TMs as assessed by cryoEM maps.
These problems are not seen when other labs use the same reagents on different targets. Typically, when SPA doesn’t work, there are zero specific counts rather than some linearly increasing unaccounted-for background. It may, then, be that SPA with tritiated amiloride derivatives does not work with, or is significantly more difficult for, members of the ENaC/DEG family.
3.3.2 A sodium flux assay shows promise
After abandoning SPA I went in search of a new, more direct means of assessing ENaC function. I had previously used a K+ flux assay when working on GIRK and decided to try adapting it to Na+ flux. For an example of this assay, see Figure 1C of Whorton and McKinnon10.
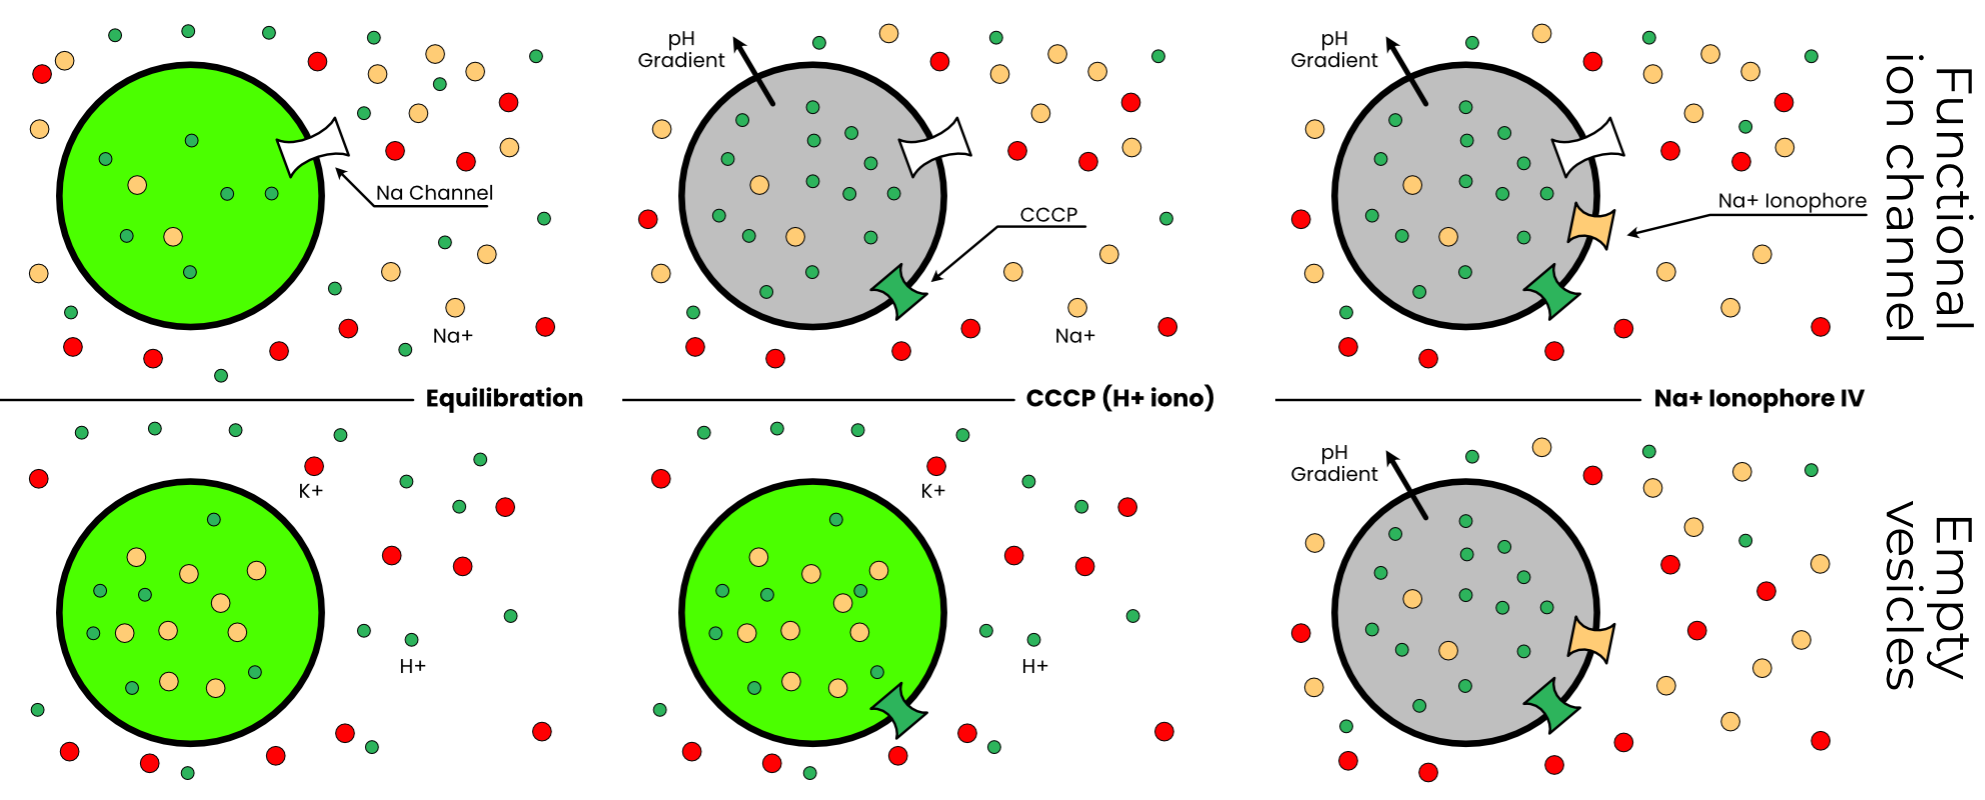
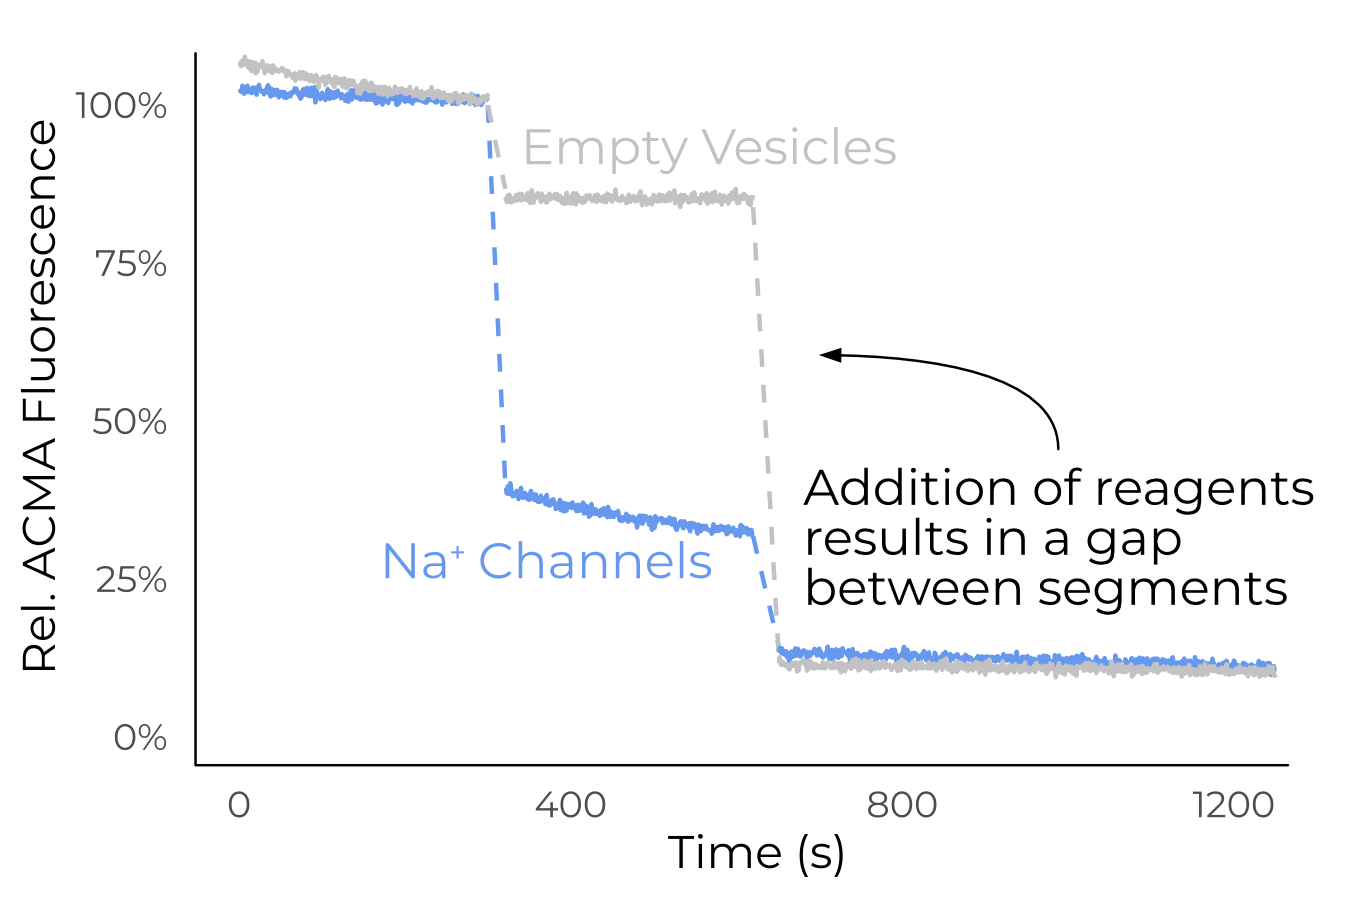
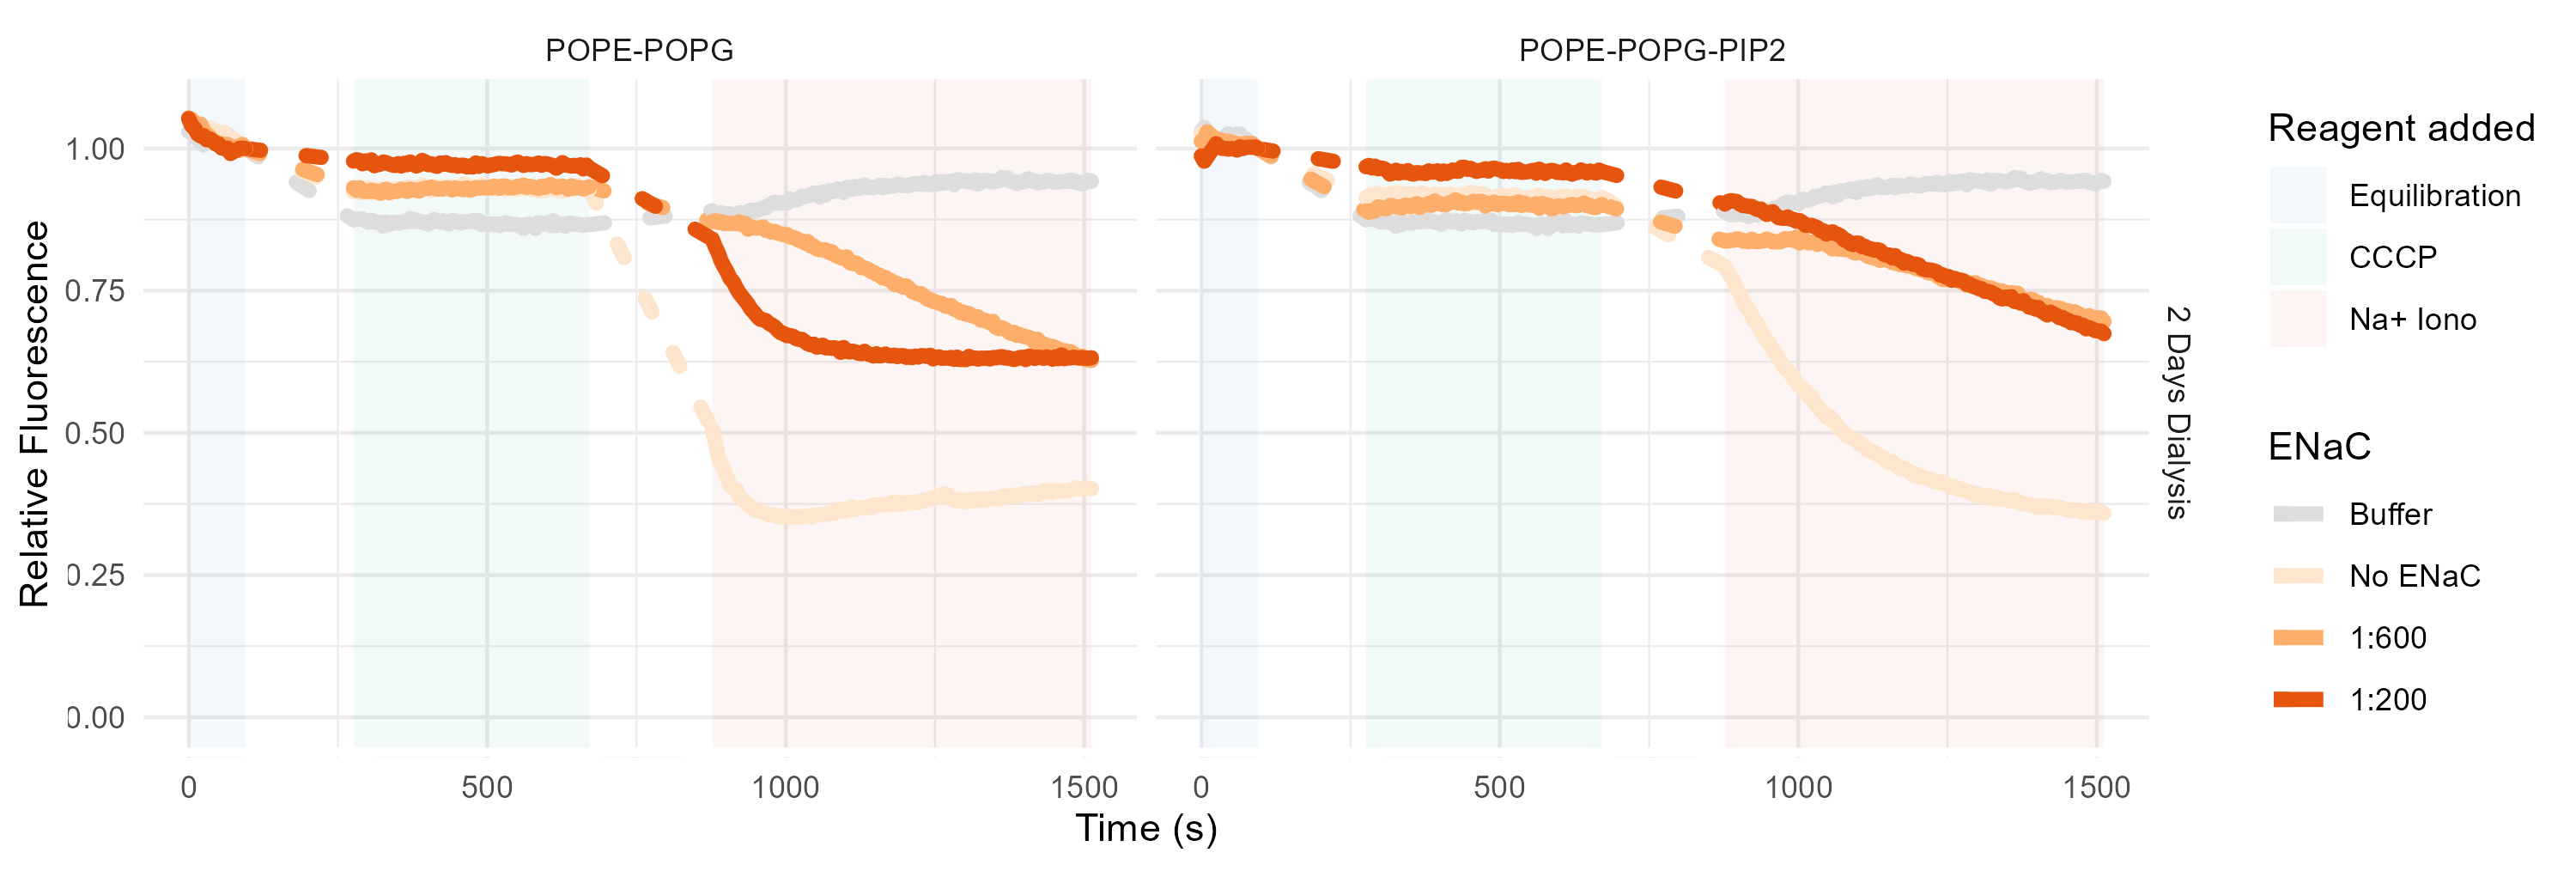
In the canonical K+ flux assay, the protein of interest is incorporated into small unilamellar vesicles with potassium buffer inside and sodium outside (Figure 3.10). Thus, in vesicles with functional sodium-selective ion channels, potassium flows out of the vesicle, establishing an electrochemical gradient. The fluorescent dye ACMA is added to these vesicles. Then, the proton ionophore CCCP is added. In vesicles with functional ion channels, protons pass into the vesicles, down their gradient. This establishes a pH gradient, which quenches ACMA. Thus, reduced fluorescence at the CCCP stage indicates functional ion channels (Figure 3.11). Finally, valinomycin (a K+ ionophore) is added to measure the minimum fluorescence.
To adapt this protocol to Na+ required swapping to internal sodium and external potassium and a sodium-specific ionophore to replace valinomycin. Luckily, several such ionophores are commercially available. None of them have quite the selectivity or flux of valinomycin, but they are less important than the CCCP anyway. I selected Sodium Ionophore IV, or 2,3:11,12-Didecalino-16-crown-511.
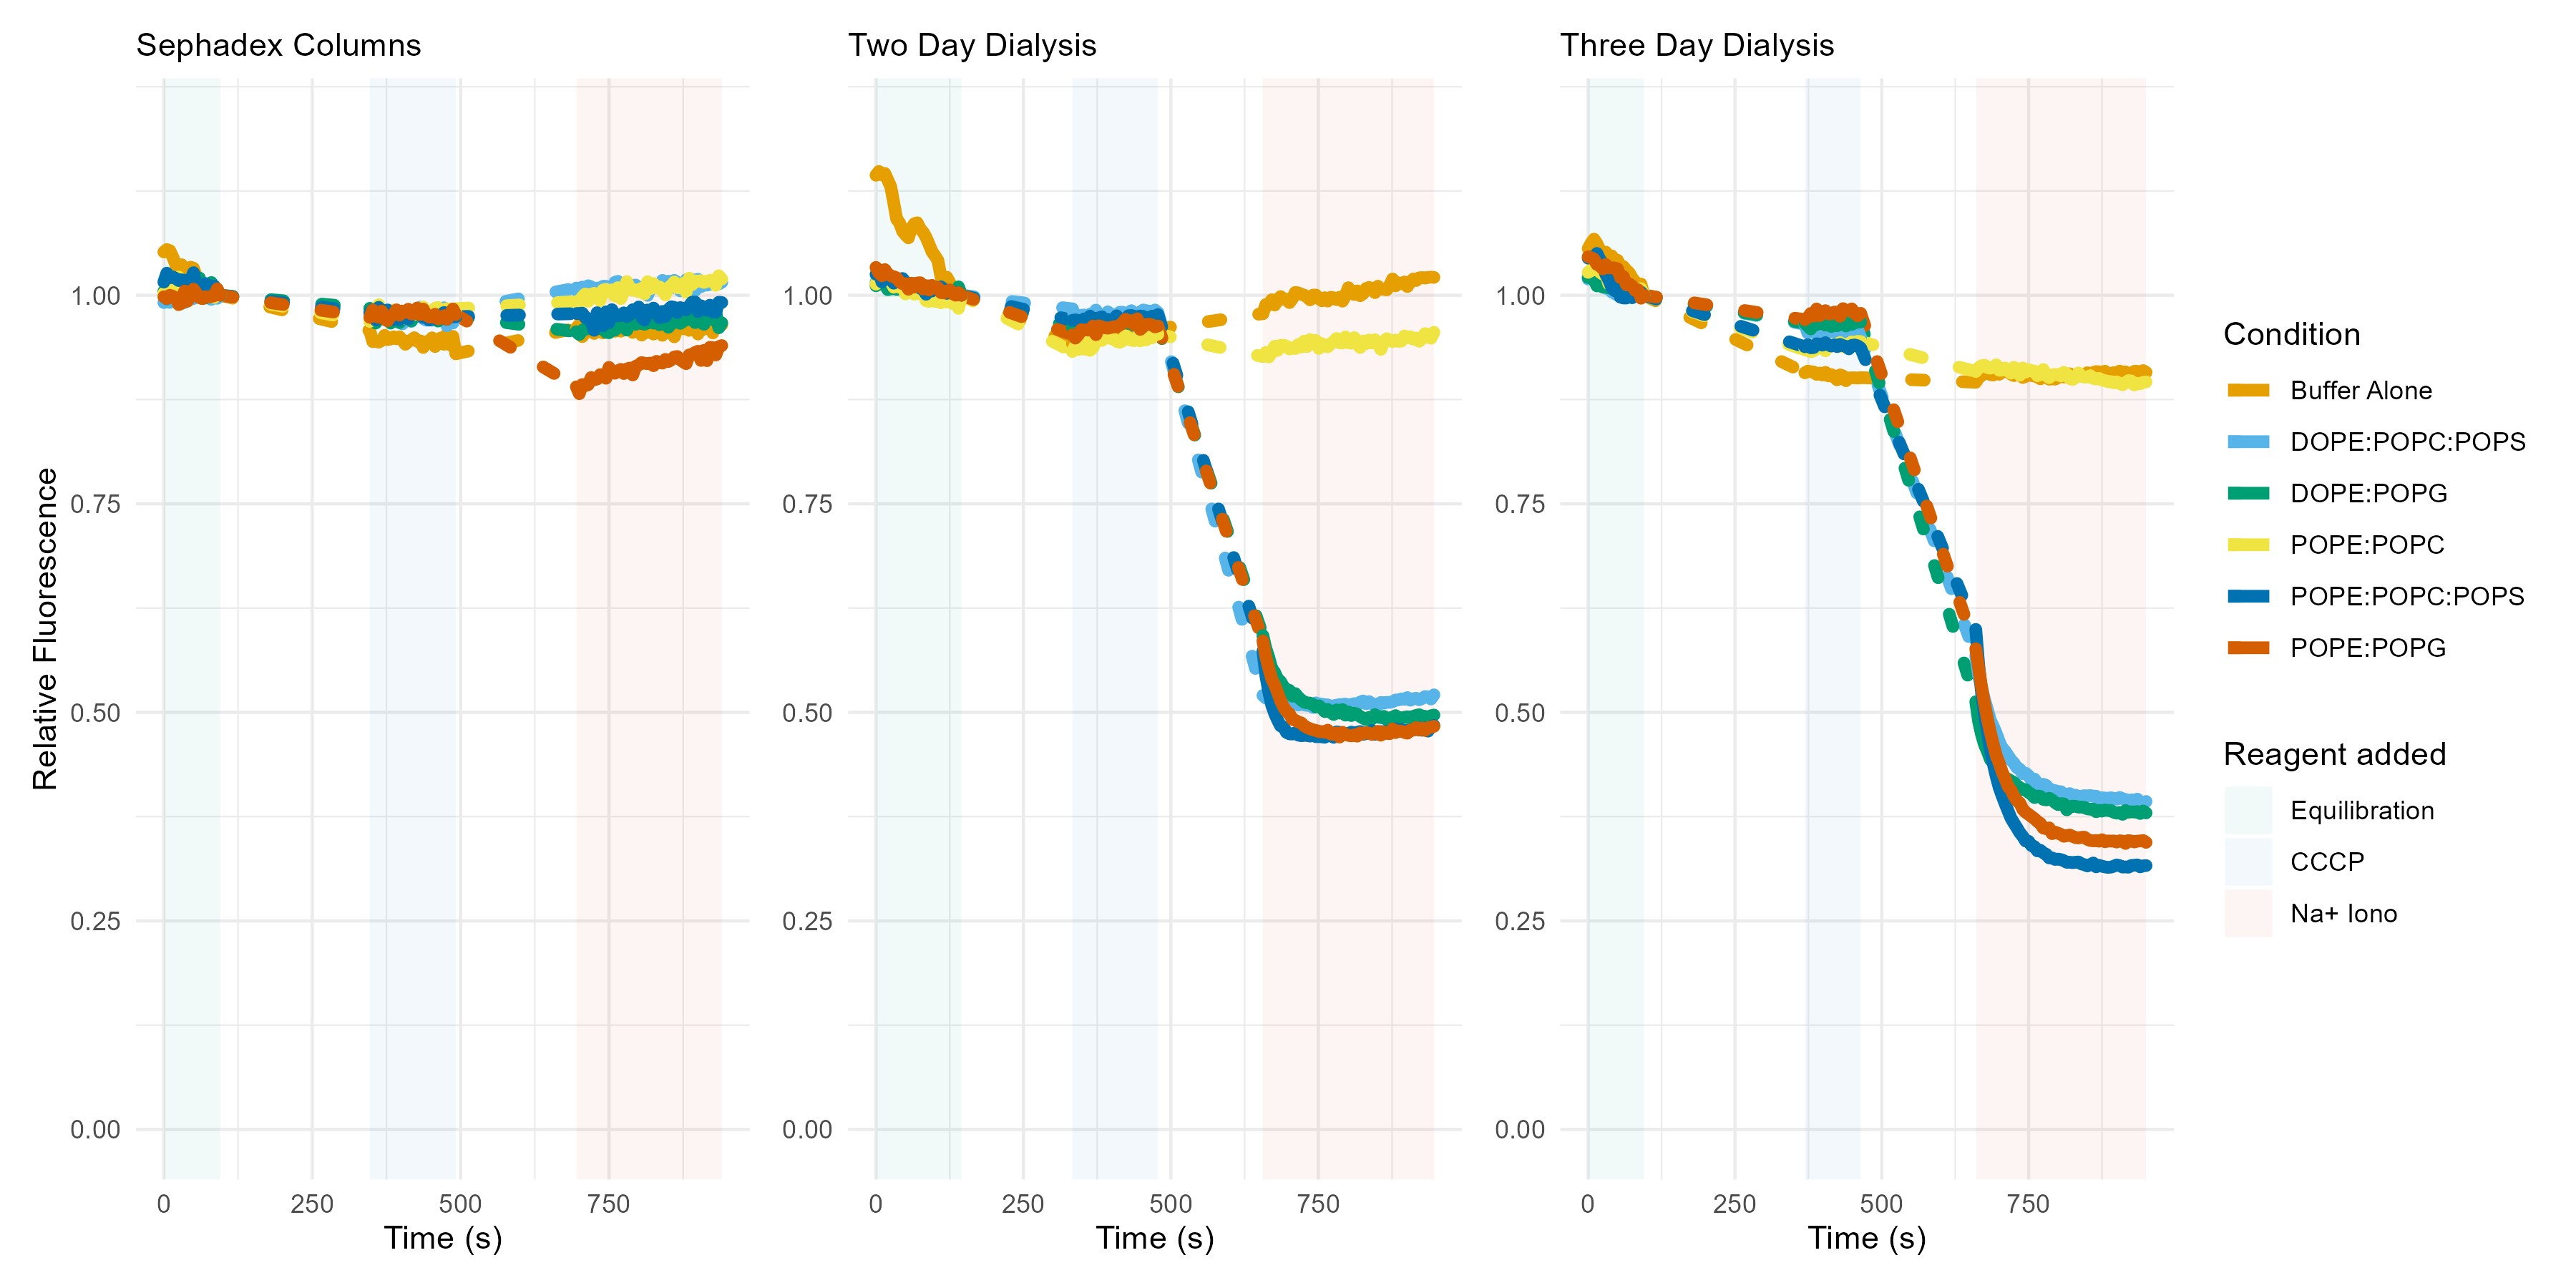
This assay was, in the end, reliably able to produce readings of empty vesicles (Figure 3.12), but ENaC never passed any ions with the addition of CCCP (Figure 3.13). Moreover, addition of ENaC in any amount seemed to disrupt the empty vesicles. It is likely, then, that the ENaC is not properly folded, or that the addition of concentrated digitonin disrupts the vesicles on its own. A good next step in the development of this assay would be a positive control with ASIC or some other sodium channel.
3.4 What can be salvaged?
I’ve tried a great list of experiments to improve the quality of our TMD, none of which really worked. Here’s what of my work can be carried forward into future studies.
3.4.1 Future studies should avoid digitonin
I believe the TMD is misfolded as a result of solubilization with digitonin. Digitonin solubilizes membranes by chelating cholesterol12. ENaC is activated by cholesterol-mediated PIP2 interactions and is found in cholesterol-rich lipid rafts13,14. Additionally, the helices in the low-resolution TMD region of truncated ENaC, which was never exposed to digitonin, do have the expected pore-lining TM2 architecture15.
Of course, all of the TMD maps to date are very low-resolution. Although I am confident in my TM assignments, it is possible that the wrong TM identity has been assigned to some of the densities. Hopefully future, higher-resolution maps of the TMD will settle the matter.
3.4.2 Cysteine knock-out mutations should be abandoned
The CKO mutations do increase ENaC yield, but their theoretical underpinning is not sound at all. Channels with either one of γC33A and/or γC41A exhibit reduced PO and increased SSI compared with wild type despite no change in surface expression1. More worryingly, γC33 and C41 border the HG motif — any disruption here might have serious consequences on the physiological relevance of a resolved TMD structure. Beyond the concerning question of whether the mutant channels would then recapitulate physiological ENaC gating processes, they clearly act in opposition to the goal of creating channels biased to the open state in CKO/DEG.
Recall that CKO channels have the following mutations in addition to protease site knockouts: αC63A, βC30A, and γC33,41A
Conversely, if the goal is to disrupt palmitoylated sites (which, nominally, it was not), why are αC63 and βC30 knocked out when they are known not to be palmitoylated in the cell2? Or, if the goal is to knock out all potential palmitoylation sites, why are the majority left un-mutated? Fundamentally, the CKO mutations are logically inconsistent and should either be abandoned or consolidated behind a single theory of action.
3.4.3 Acid shock
I briefly tried “acid shocking” ENaC during the purification. My thinking was that poorly folded ENaC would be the first to aggregate under stressful conditions, leaving behind higher quality material. Similar treatments could have been high temperature or salt concentrations — there was nothing theoretically special about pH aside from the fact that ENaC and channels like it are sensitive to pH.
I did not notice a difference in total yield (beyond the losses expected from salt exchange alone), leading me to believe that the procedure did not have any real effect on ENaC, regardless of its folding state. Additionally, maps made with acid-shocked material (CKO digitonin and CKO/DEG difab) are not of substantially higher quality than the other, un-shocked maps.