Appendix B — The Graveyard
In this appendix, I will go into more detail on experiments that did not work, or that did not produce interpretable results. I will also discuss dead ends on the protein purification pathway to guide future efforts. This section is isolated from the main body of the text since it is only interesting to those who may follow after me. As such, a basic familiarity with lab protocols is assumed.
B.1 Nedd4-2
Early on, my work included purification of Nedd4-2 with an eye toward both a functional assay for Nedd4-2/ENaC interaction and a structure of the bound complex. Nedd4-2 comprises structured domains connected by disordered linkers, and so it should come as no surprise that this proved too difficult and time consuming and was dropped1,2. However, it may be that adding Nedd4-2 helps to resolve ENaC’s TMD and even regions of the intracellular loops, so future research into the topic may yet prove fruitful.
B.1.1 Expression and purification
B.1.1.1 Insect cells and TALON
Nedd4-2 was initially expressed in Sf9 cells as a C-terminal GFP fusion. Cells were infected at an MOI of 5 and left to express protein at 21 °C for 48 hours. Cells were collected via centrifugation (100k xg for 45 minutes) and frozen in liquid nitrogen until use.
Cells were thawed and resuspended in 100 mL TBS per flask, then sonicated for a total of 5 minutes of 10 seconds on, 30 seconds off, power level 7. Crude lysate was centrifuged for 45 minutes at 100,000 xg and clarified lysate collected.
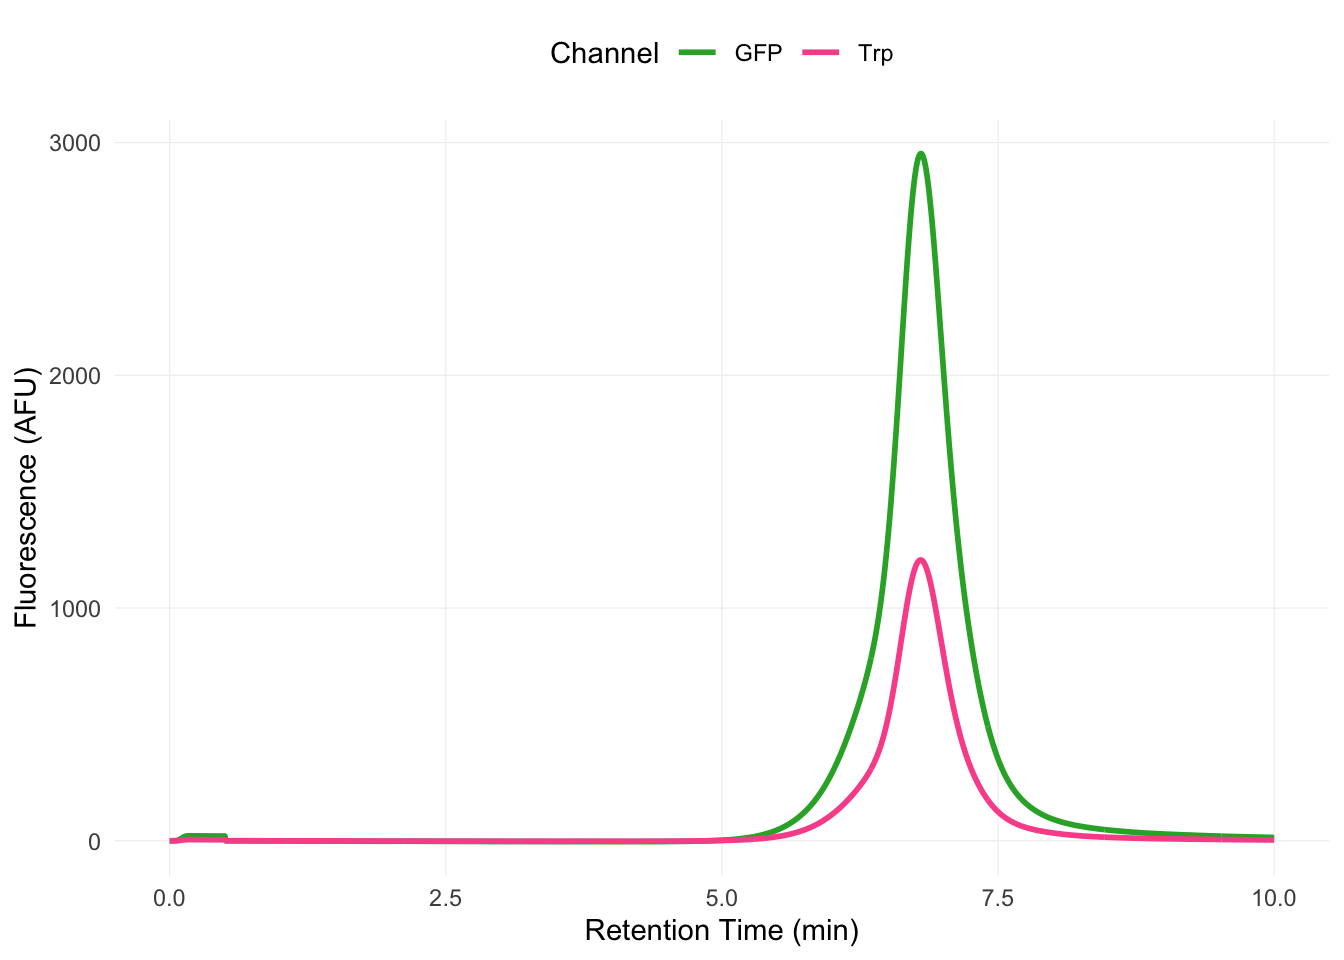
Clarified lysate was bound to 10 mL TALON resin per flask and washed with 5 CV TBS followed by 2 CV TBS plus 10 mM imidazole. Finally, 1 mL fractions are collected from a 4 CV elution with 250 mM imidazole. These fractions are concentrated and sized on a Superose 6 Increase 10/300 column (Figure B.1). The SEC protocol for Nedd4-2 is essentially unchanged from that for ENaC (Section A.2.1), with the exception that TBS alone (i.e., without detergent) is used as a running buffer.
There are several problems with this protocol. First, tagging a Nedd4-family ligase on its C-terminus renders it completely non-functional. This is probably why yield is so high and pure — the protein is incapable of affecting itself or the cell in any way. Second, most of the field uses material prepared from E. coli, and it’s generally best to follow convention. Finally, Nedd4-2 harbors a cryptic thrombin site, so GFP cleavage also cleaves the protein.
B.1.1.2 E. coli and strep tags
I thus moved to expression of strep-tagged material in E. coli. The Nedd4-2 gene was cloned into pJAC148 and transformed into BL21(DE3) cells. At OD600 0.75, expression was induced with 250 μM IPTG and transferred to a 16°C incubator and allowed to express overnight. Cells were pelleted and frozen with liquid nitrogen.
Following a standard strep purification protocol, the material looks significantly worse than that purified by IMAC (Figure B.2). I believe this is most likely due to the fact that this material is actually functional, which means it is capable of self-degradation. It also likely puts the E. coli cells under significantly more stress than non-functional material.
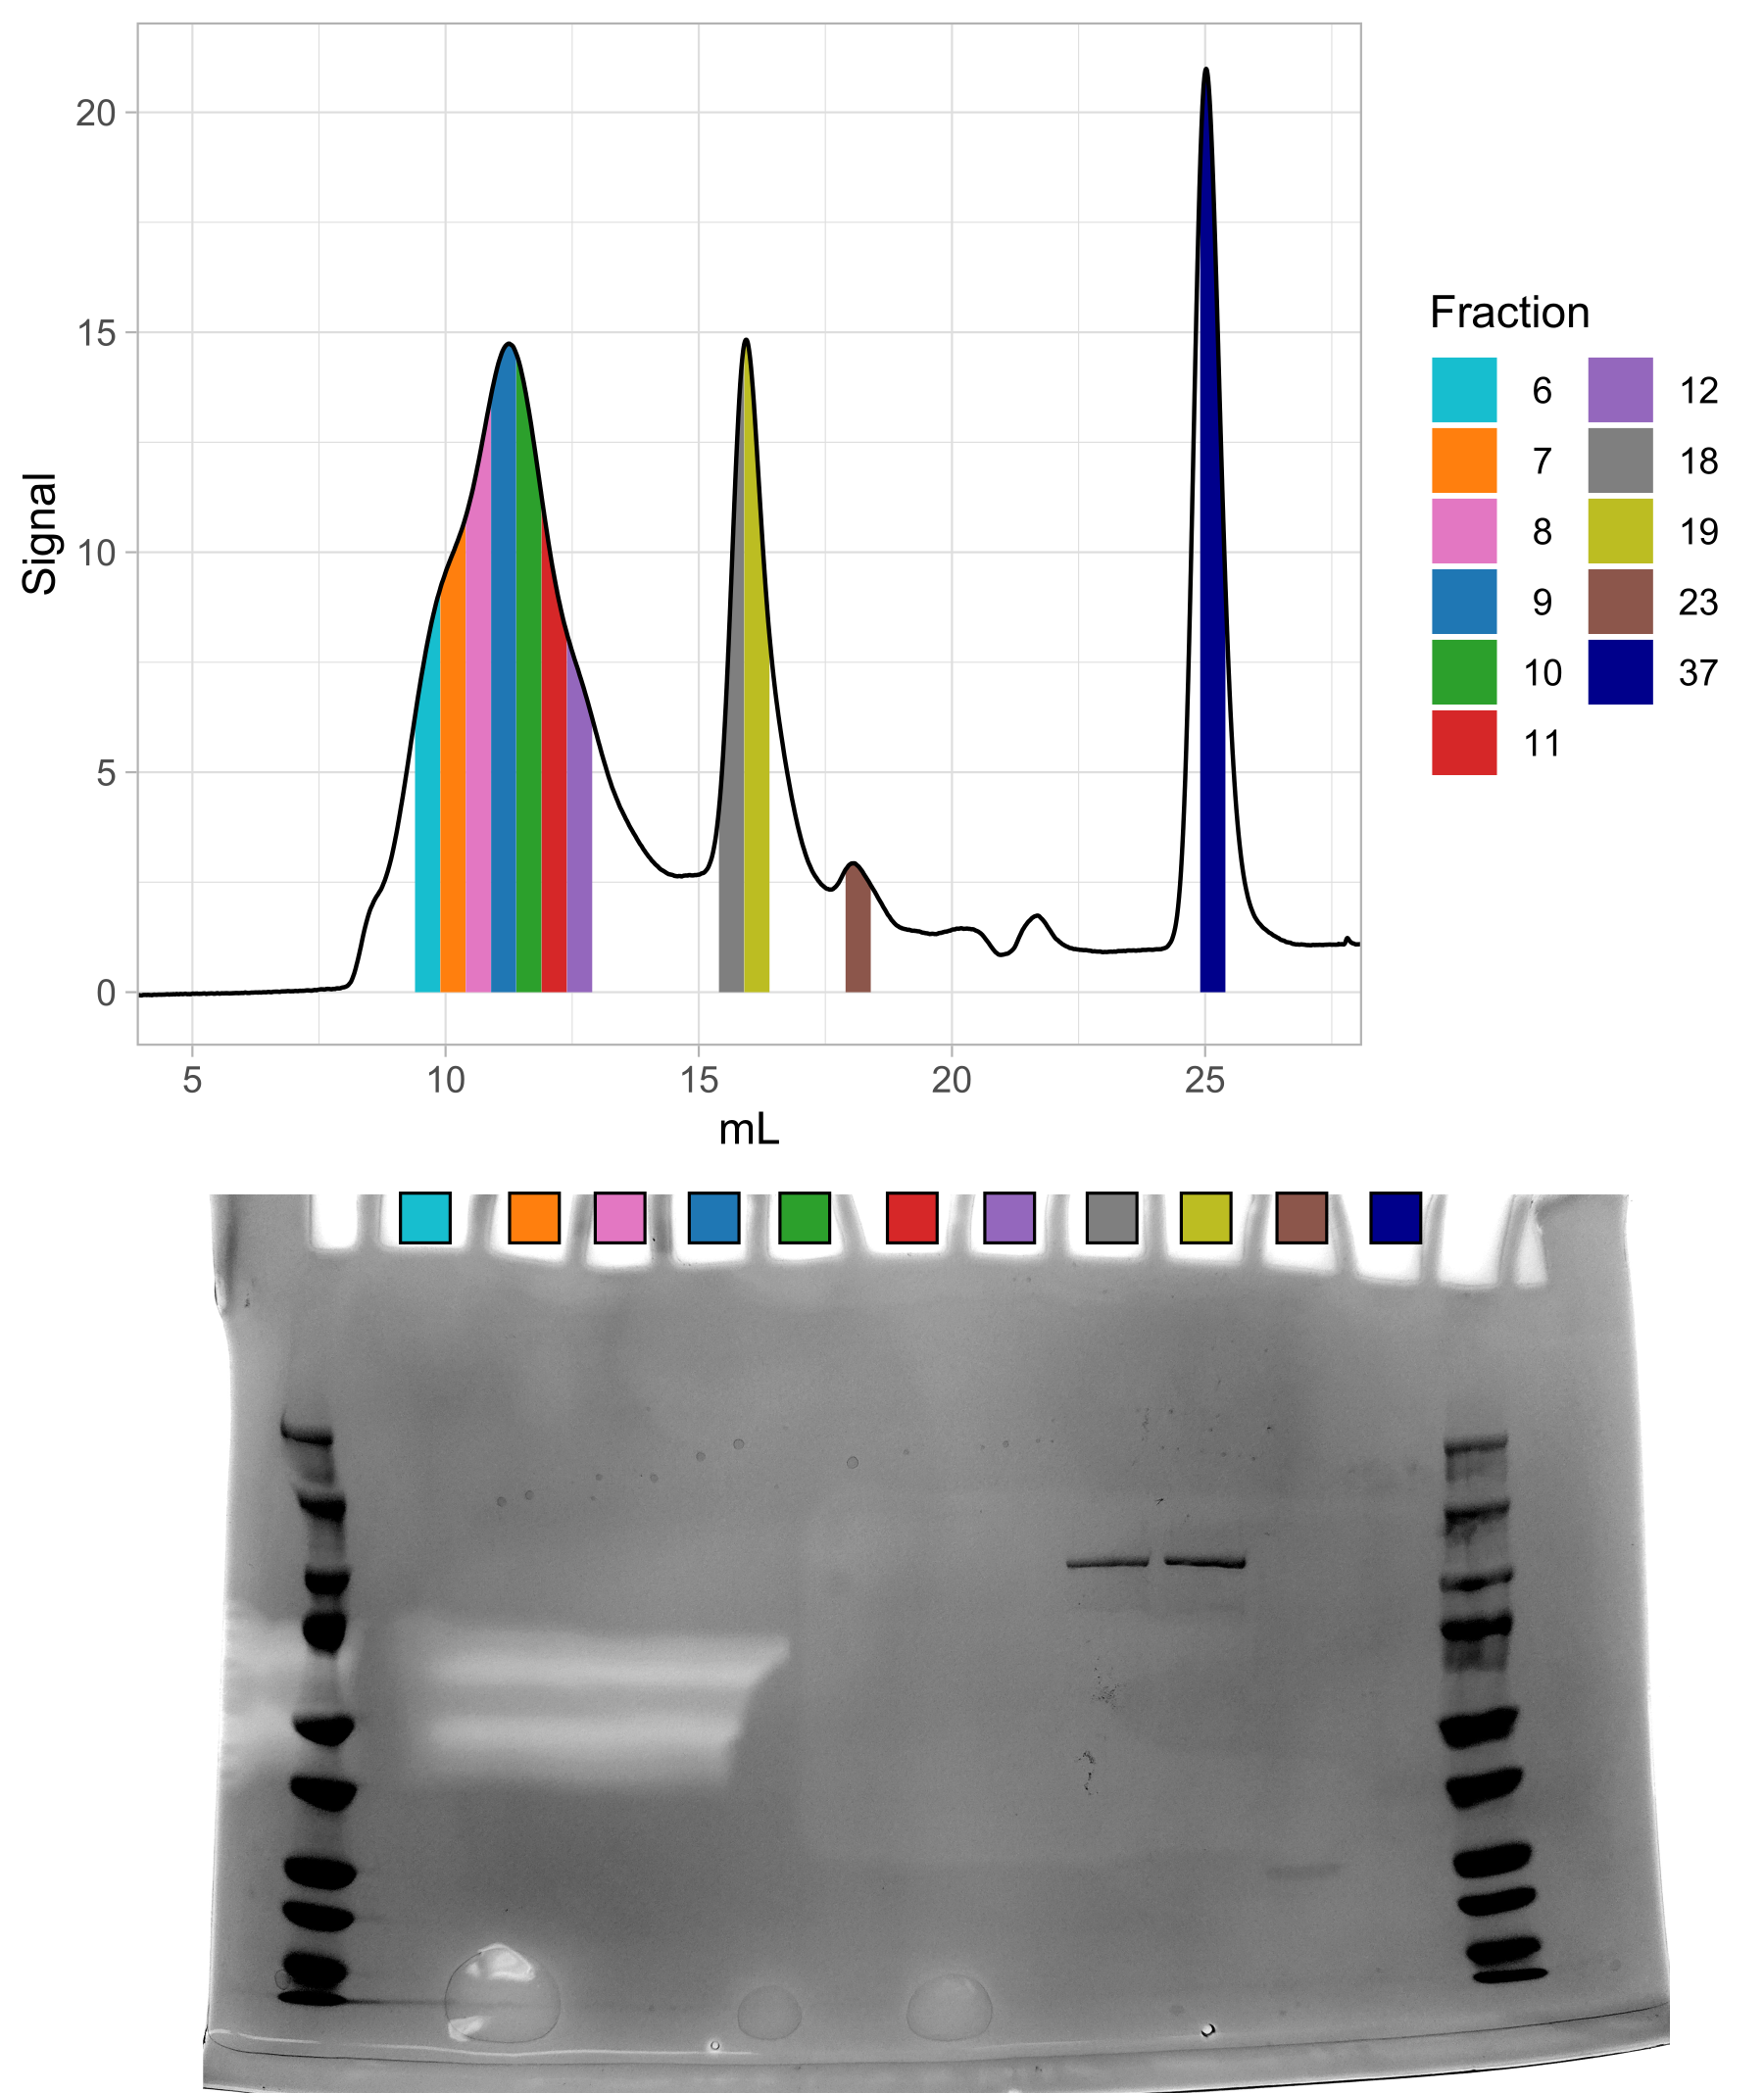
This material, obviously, contains a large leading peak centered around 11 mL. Since there seems to be no protein at all in this peak, but it is after the void volume, I suspect it is nucleotide contamination. In any case, this protocol seemed the most reliable means by which I could purify large amounts of (potentially) active Nedd4-2.
I do not have A260/A280 measurements for this material, unfortunately
B.1.2 ENaC Binding
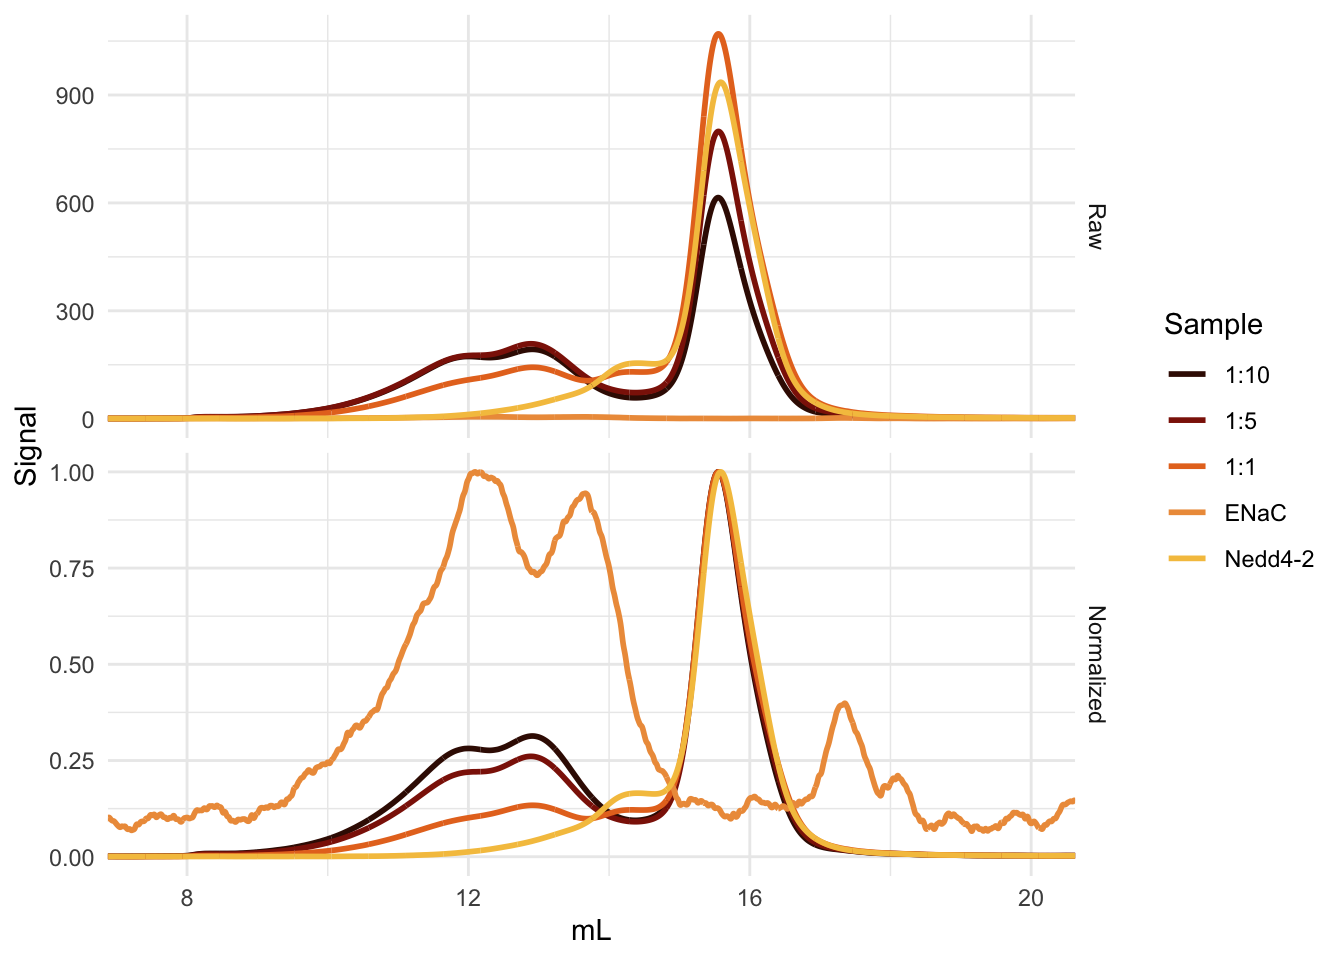
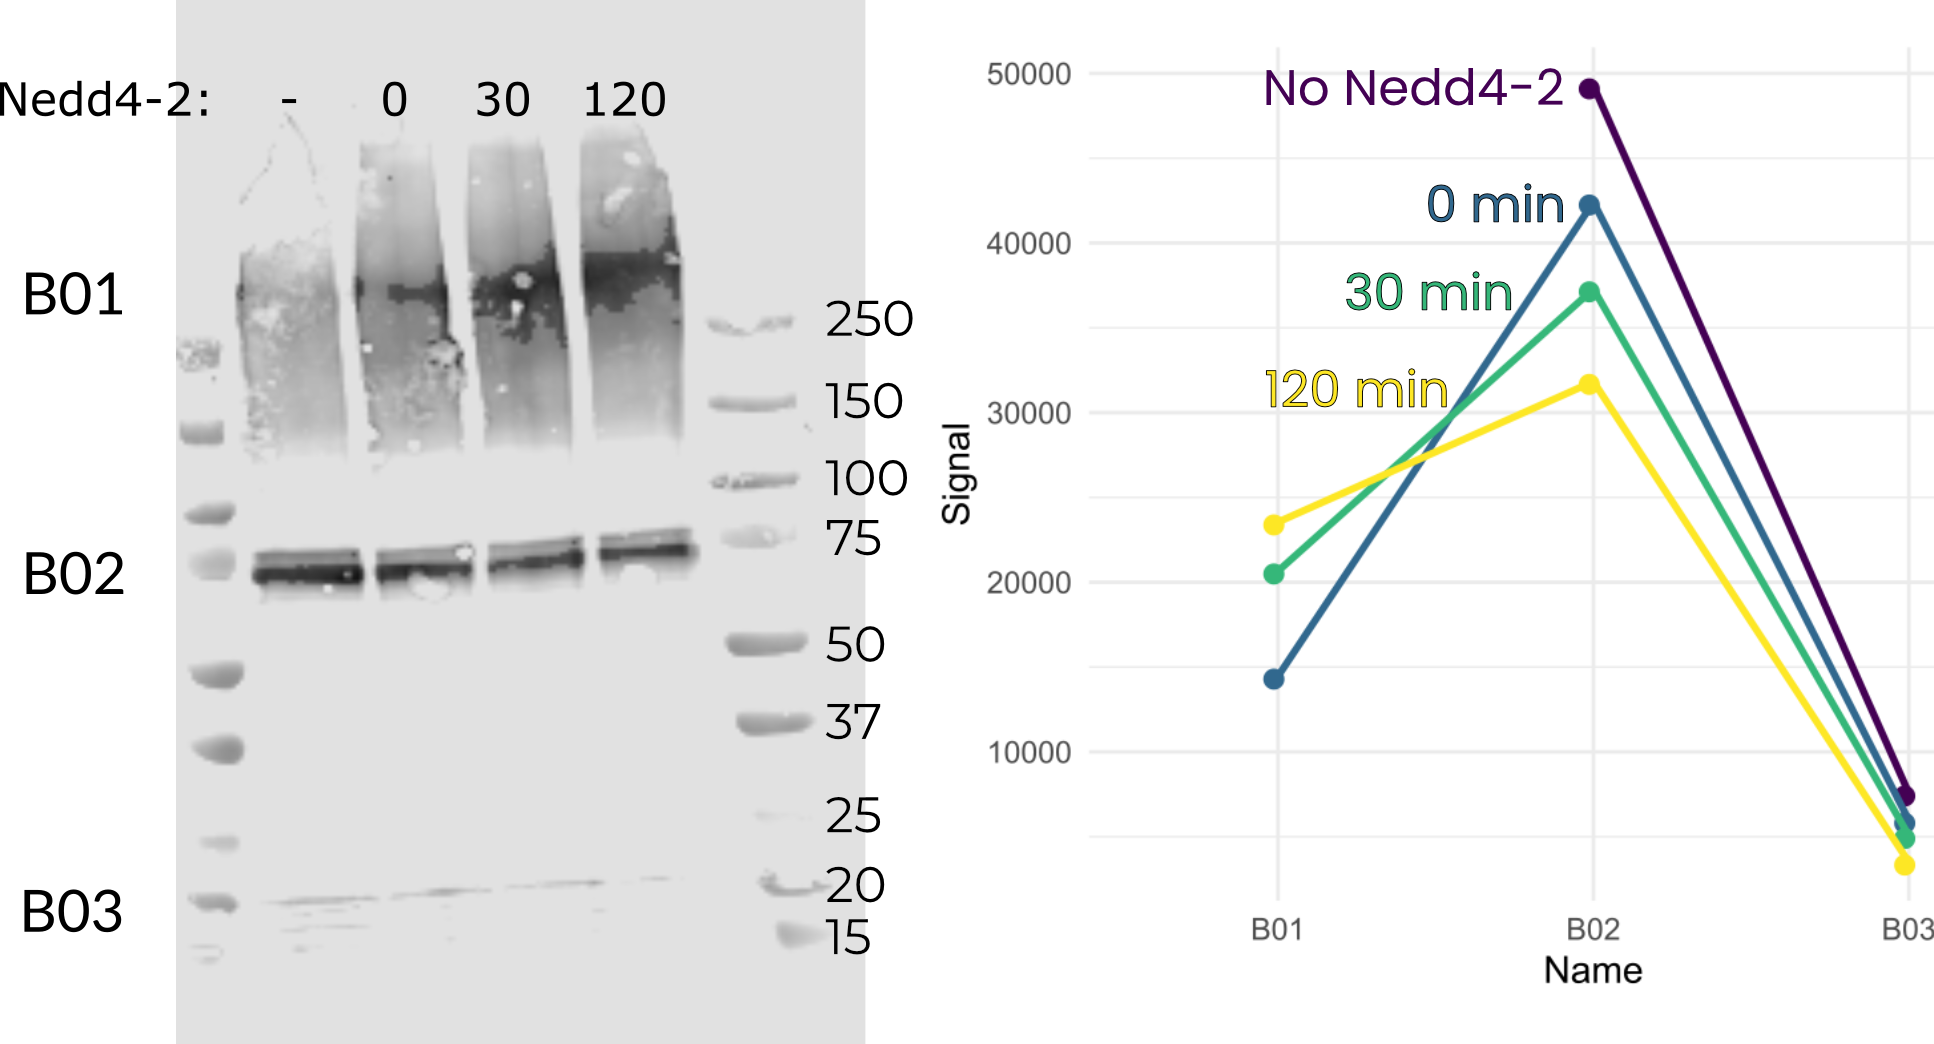
The Nedd4-2 purified from both Sf9 cells and E. coli binds ENaC. A simple, single-replicate experiment shows increased movement of GFP-tagged Nedd4-2 from its unbound peak to a peak eluting before ENaC (Figure B.3). This is, of course, not an entirely rigorous experiment. Most concerning is the fact that increased ENaC does not always translate to an increase in the presumptive Nedd4-2 bound ENaC species.
B.1.3 Ubiquitination assay
If this project had progressed, we would have needed a way to assess whether our purified Nedd4-2 was functional or not. My idea for this was an in vitro ubiquitination assay. Ideally, we’d take tagged ubiquitin (Ub), an E1, an E2, and our purified Nedd4-2 and incubate them together. Next we’d detect ubiquitination of ENaC via western blot. Only the mixture with all of these components should have ubiquitinated ENaC.
I made a few attempts at this, and none of them really worked. It’s not worth reproducing the exact protocols here — for the truly interested reader, they are in Lab Meetings 2, 3, and 4. The two major categories I tried were what I’d call a “minimal” or “supplementary” ubiquitination assays.
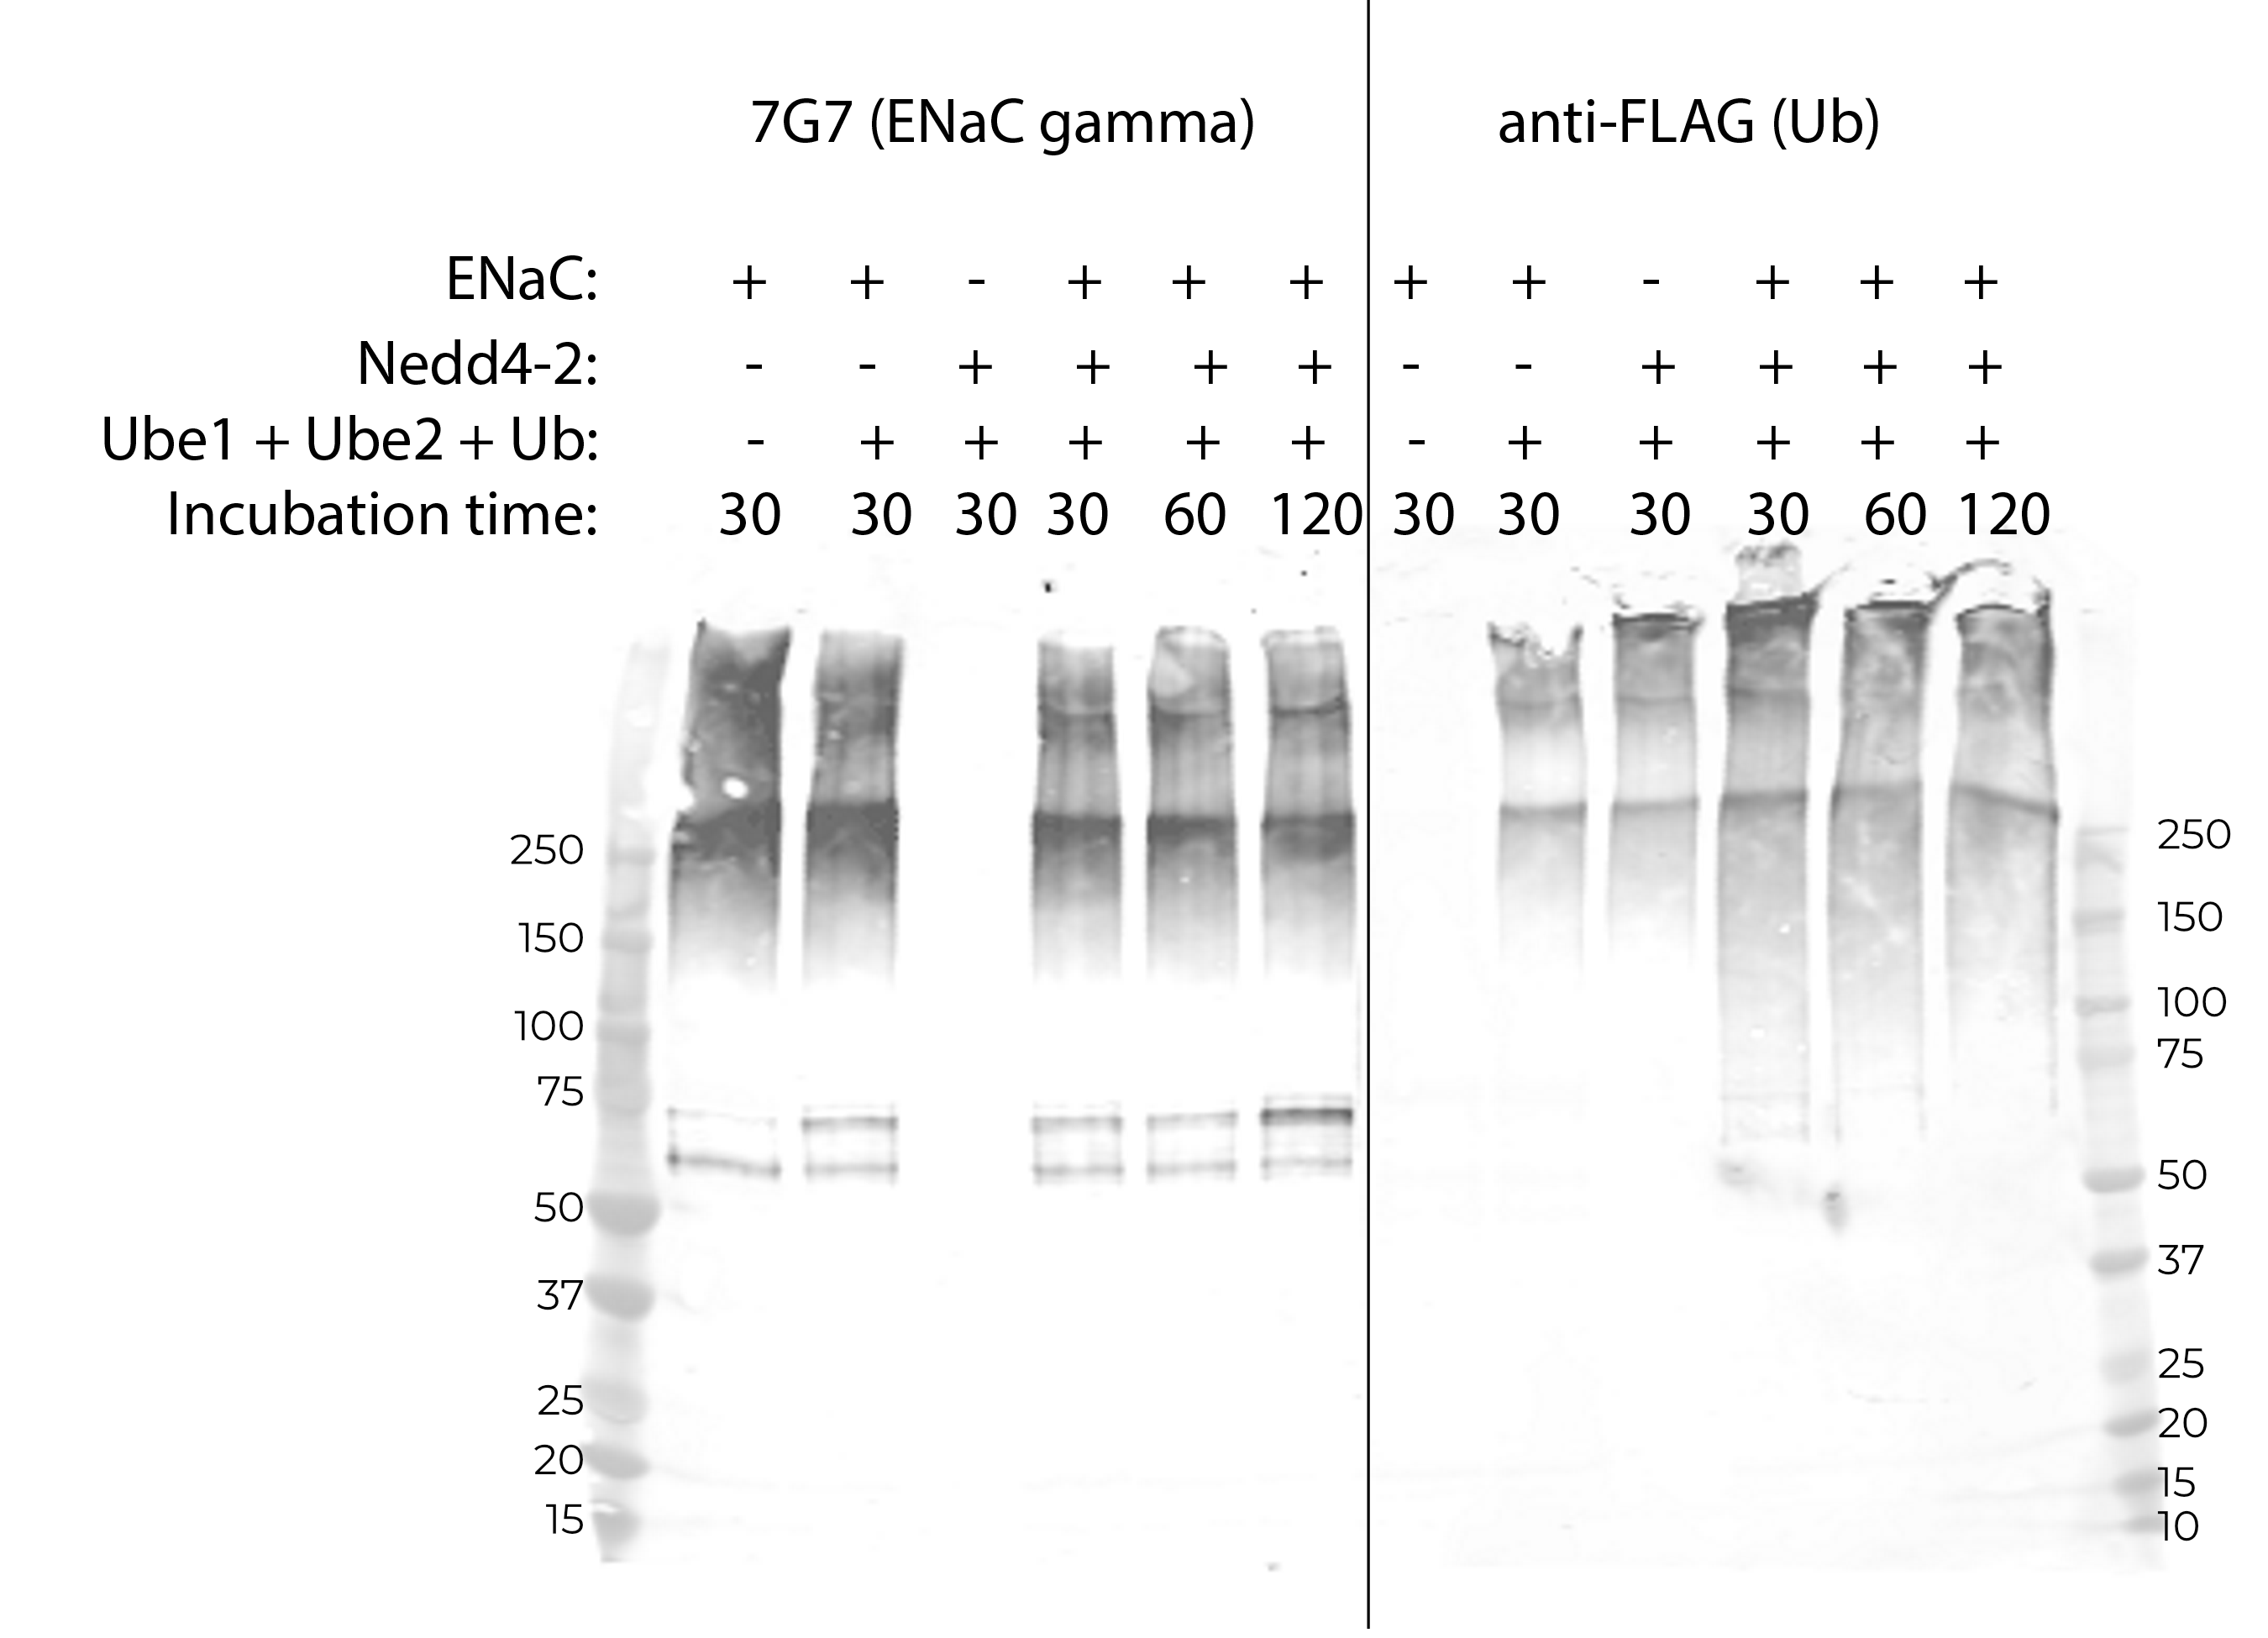
The minimal assay involved purchasing an in vitro ubiquitination kit and replacing the company’s E3 enzyme with the same molar amount of my purified Nedd4-2 (as assayed by nanodrop). Using this assay I was potentially able to detect a moderate amount of ubiquitination of ENaC (Figure B.4). However, overall signal is low, and there appears to be some ENaC-Ub signal in lanes without purified Nedd4-2. Additionally, longer incubation times do not result in stronger ENaC-Ub signal. I take it from this assay that our purified material was not functional.
However, my western blots are never great, and it may be that refinement of the detection technique is required. For instance, another of my blots for the minimal assay did seem to show some ubiquitination by our purified Nedd4-2 (Figure B.5). Regardless, this inconsistency means the assay needs work in addition to whatever work needs doing on Nedd4-2 and ENaC themselves.
For a supplementary assay, I add purified Nedd4-2 to rabbit reticulocyte lysate. The idea was to check for increased ubiquitination when more E3 enzyme is added. I never ended up running this assay because it made less sense than the minimal assay, and I abandoned Nedd4-2 before I could get to it.
B.1.4 What should be done?
If I were starting over, I’d find a good positive control to make sure we could test the function of our Nedd4-2. That the purified Nedd4-2 is much more important than that it binds ENaC. Next, an assessment of the necessary ratios and concentrations for stable complex formation would be useful. I expect that some form of cross-linking would be required to guarantee complex formation on the grid without overcrowding.
Ultimately, though, I think I was right to abandon this facet of my project. The domains of Nedd4-2 have already been resolved, and it seems to be largely unstructured aside from those domains. Rather than rely on it to help align the intracellular and transmembrane domains, I would try a megabody or other scaffolding system.
B.2 Scintillation Proximity Assay
As discussed in Section 3.3.1, SPA never worked for anybody in our entire lab, working across three proteins. As a reminder, our main problem was that specific and non-specific counts were essentially indistinguishable.
Ideally, non-specific counts increase linearly and specific counts increase logarithmically with increasing substrate, and signal-to-background ratios should be around 1.53. Our background and “specific” counts both increased linearly with more substrate, leading me to believe that our “specific” counts are merely unaccounted-for background. Additionally, our signal-to-background ratio typically falls between 0.2 and 0.01 (one to two orders of magnitude too low). Finally, our “specific” counts are often negative.
If you’re saying to yourself, “Well then it just seems like your protein isn’t binding the ligand at all” I’d agree with you. I don’t think playing around the edges here will fix anything. It is worth noting that the same exact trends occur in ASIC, which we know has a properly-folded TMD by cryoEM. This indicates that there is likely something fundamentally wrong with our process, rather than (or, more likely, in addition to) something wrong with our purified ENaC.
B.2.1 BSA
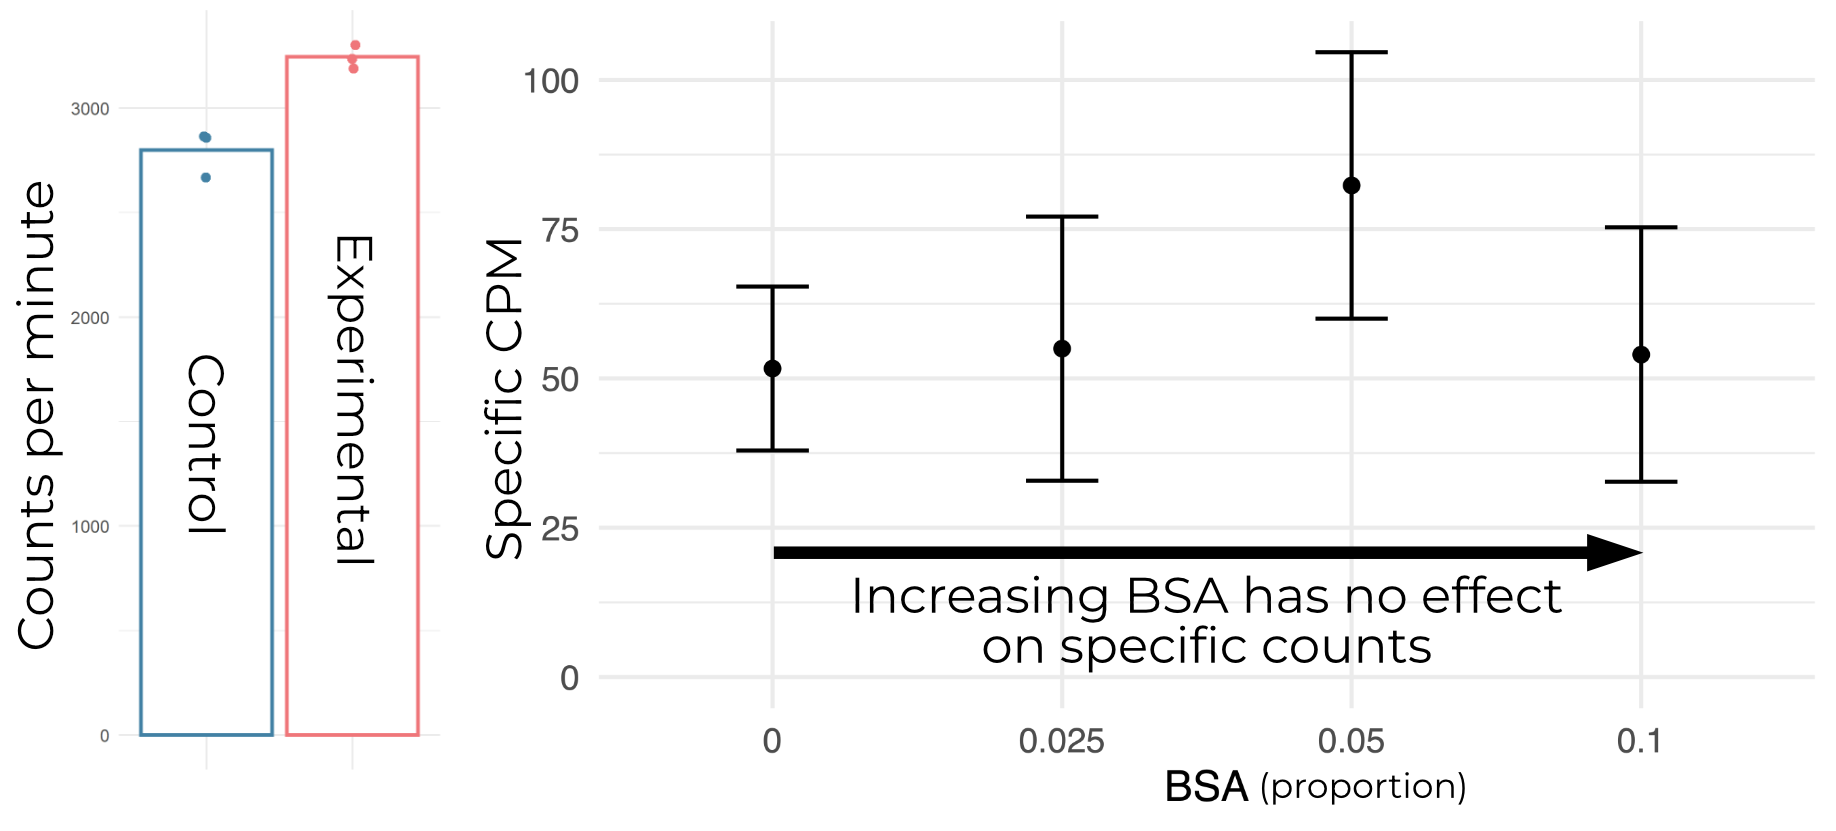
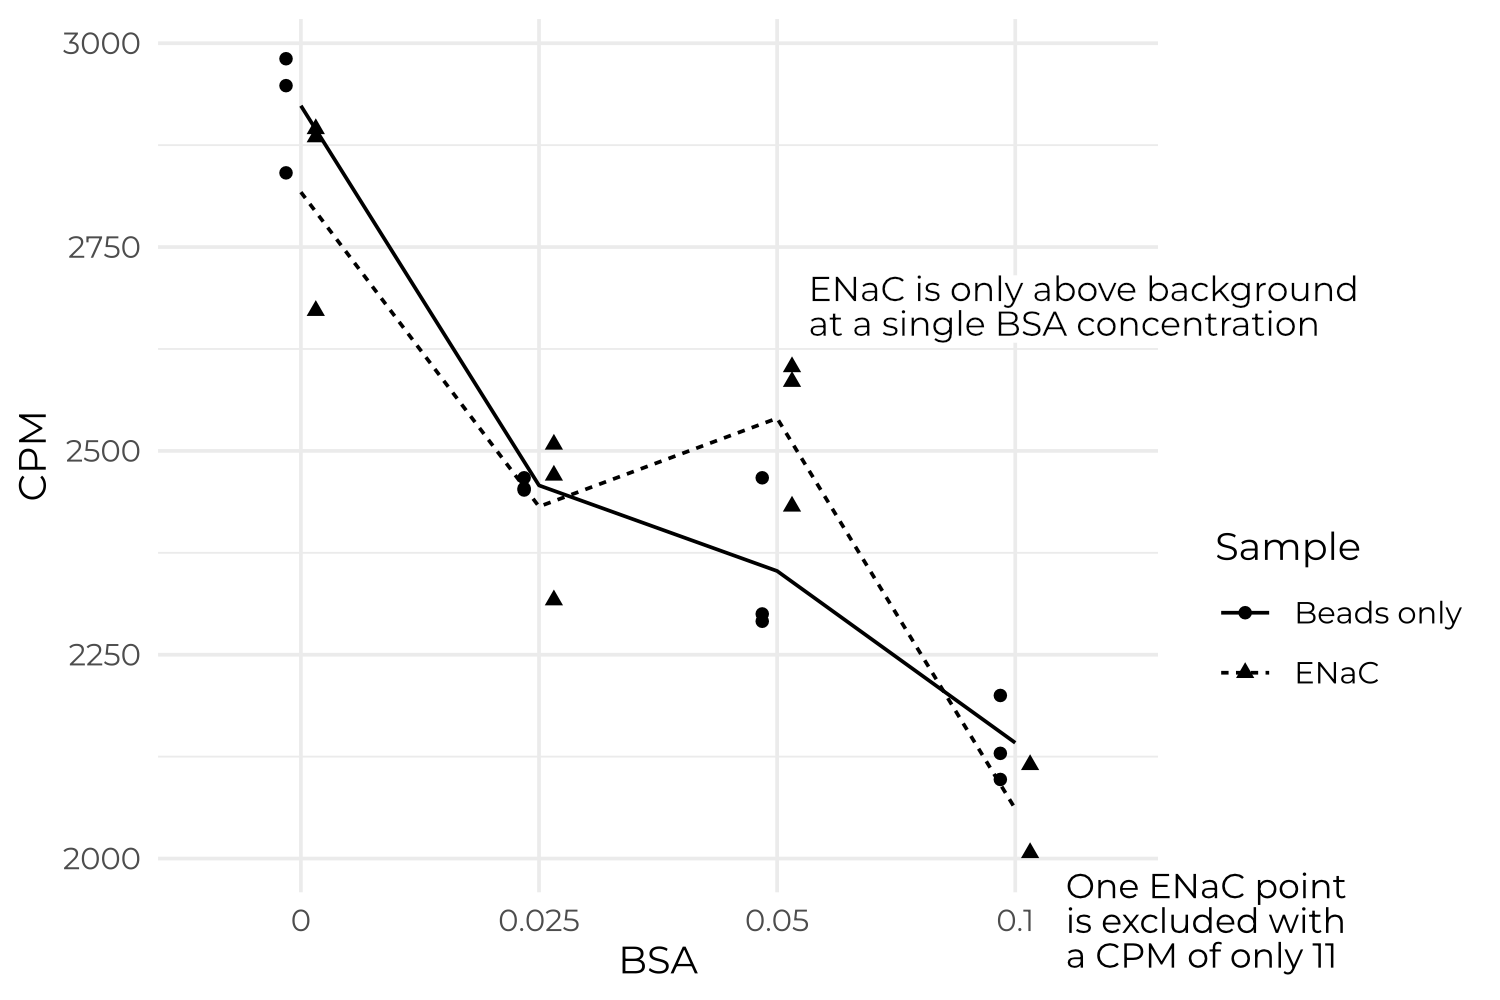
It’s fairly common practice to include additives to reduce non-specific binding in SPA assays. We tried BSA, which is typically added at around 5%. Surveying a number of percentages around there yields no improvement in background or specific counts (Figure B.6).
Changing the acidity of the mixture, alongside the pH, does not improve background or specific counts (Figure B.7). I also include this plot to show that specific counts are, more often than not, negative.
B.2.2 Data collection time
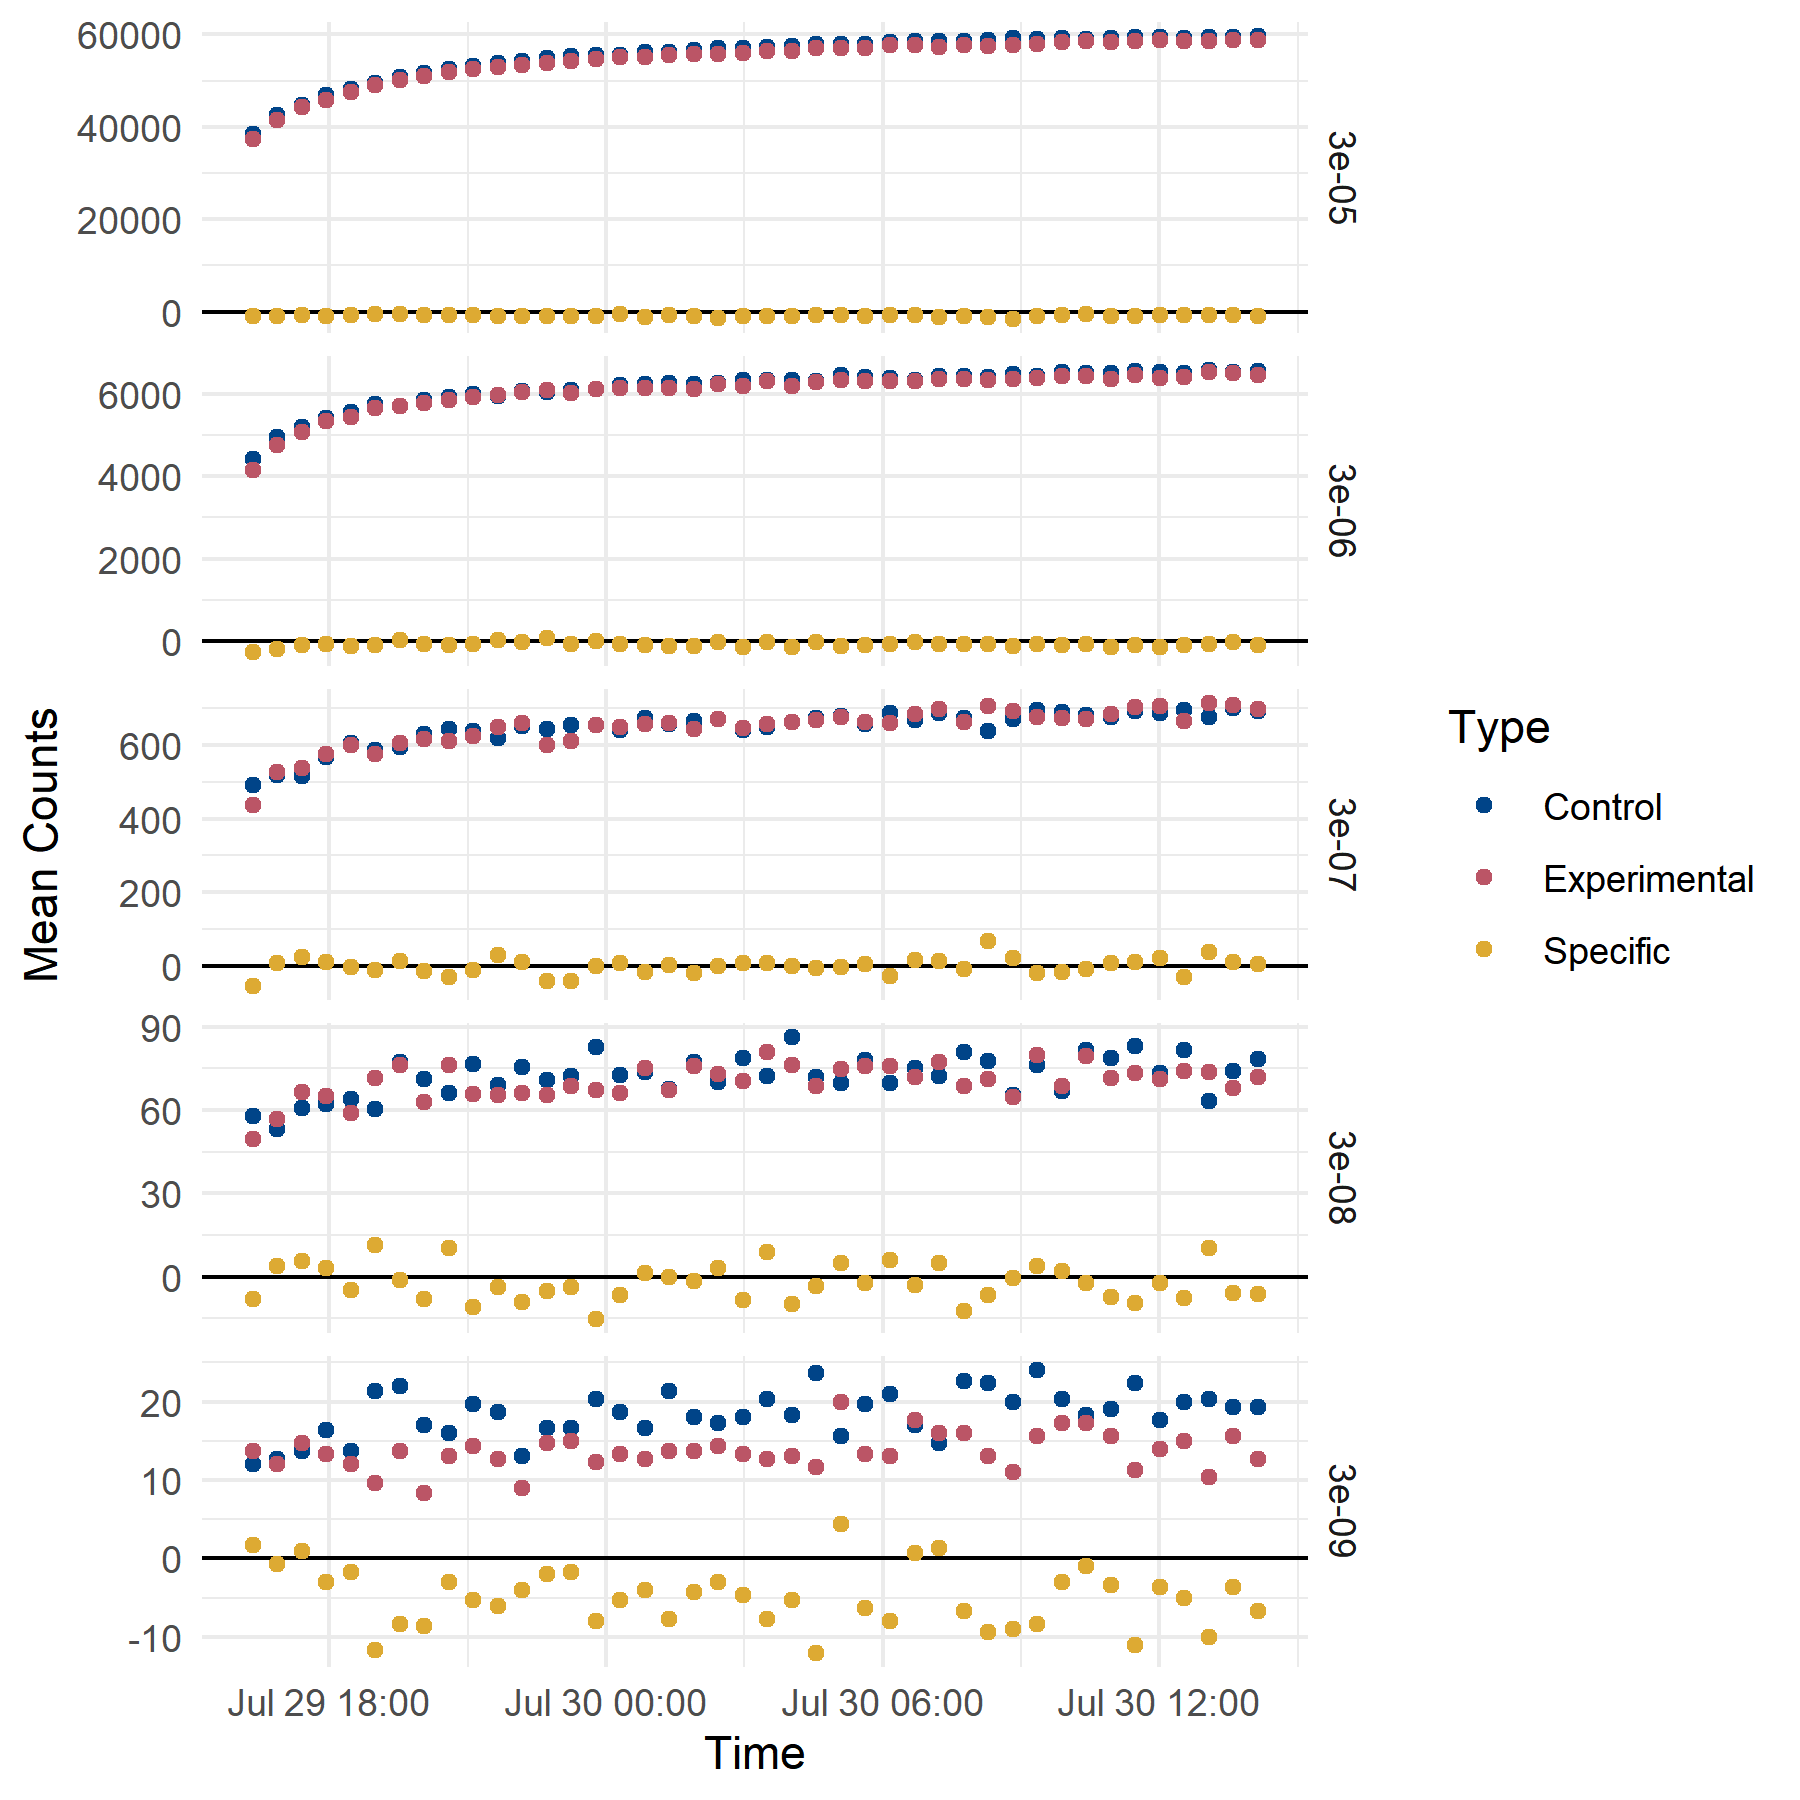
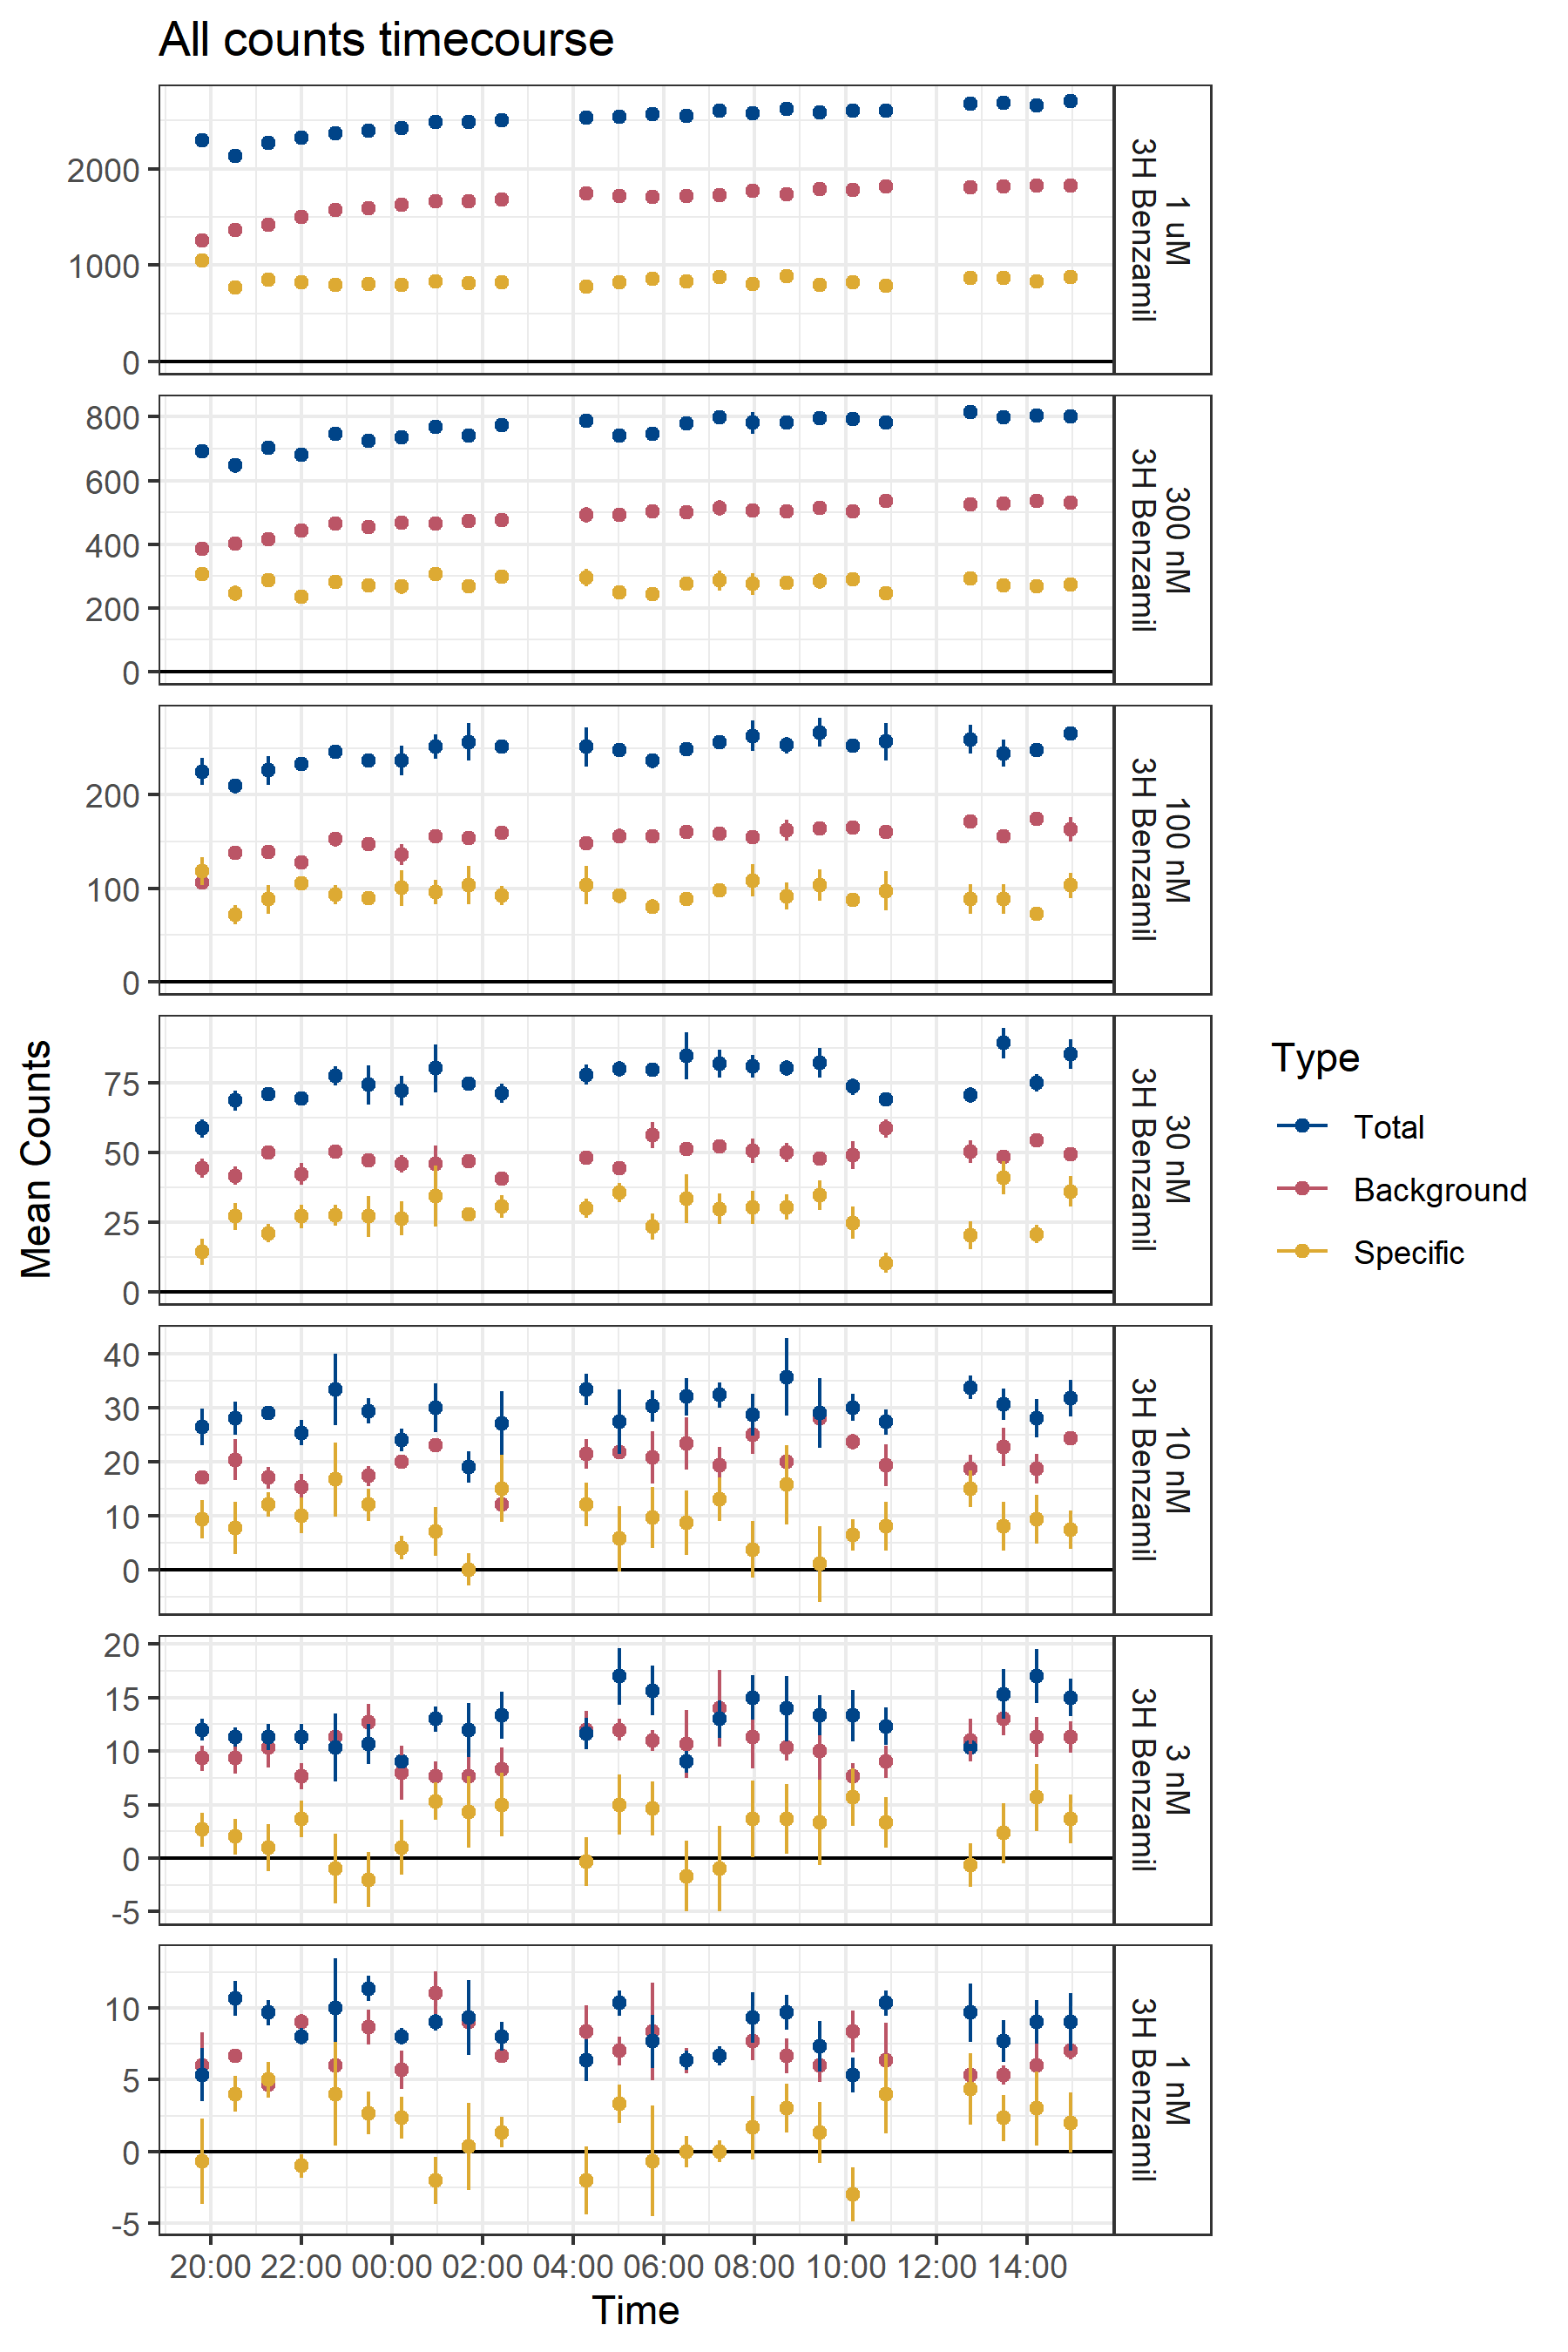
The time at which data are collected changes the result (Figure B.8). Counts are recorded from a plate, and the amount of incubation required to reach a steady signal must be determined empirically. However, with low specific counts, the selection of recording time can dramatically change the interpretation of results.
B.2.3 Membrane memetic
Switching from digitonin to nanodiscs yields a marginal improvement in that specific counts are generally positive (Figure B.9). However, specific counts still increase linearly with ligand concentration well beyond the reported Kd of ENaC for benzamil (approximately 10 nM), calling into question whether they are truly specific. Additionally, the signal-to-background ratio remains below 1.0.
B.2.4 Bead type
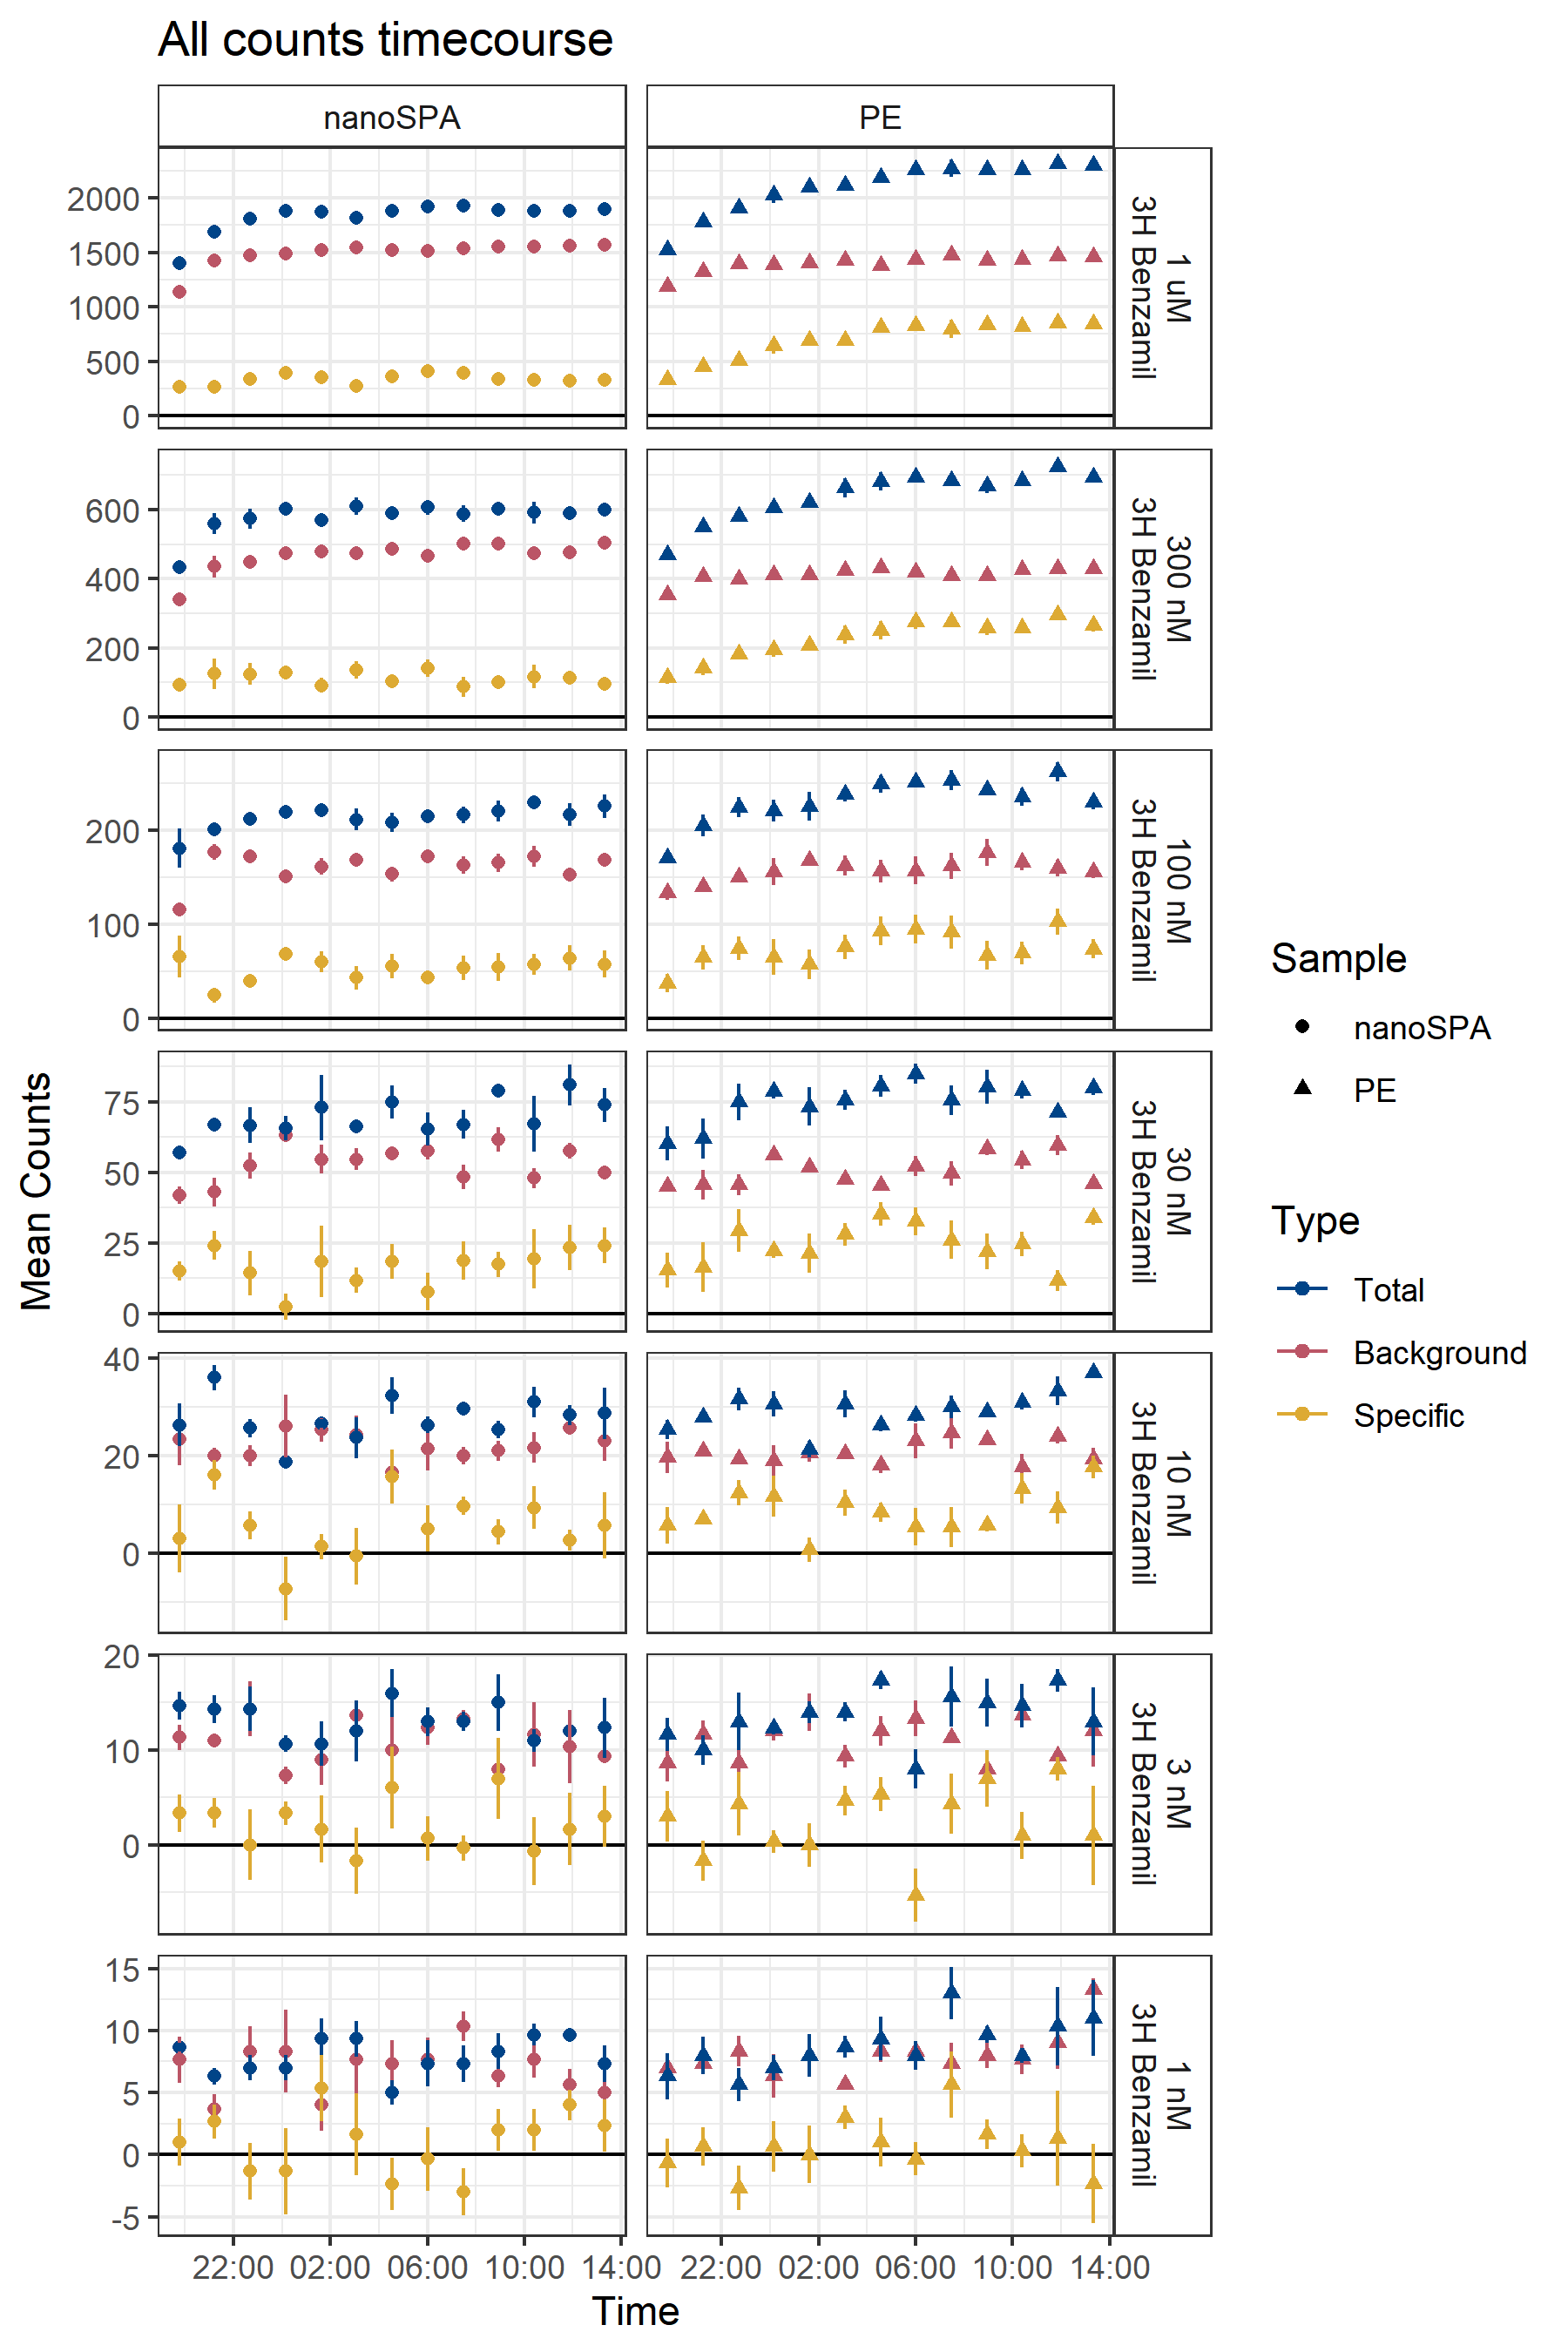
Use of nanoSPA’s smaller, lower-background beads does improve total counts, i.e., reduces the background counts (Figure B.10). It is, however, extremely important to note here that none of the samples in this experiment had any ENaC. There thus cannot be any specific counts — there is no protein for benzamil to bind! It is thus very concerning to me that the counts in this experiment follow the same trend as our proper, ENaC-containing experiments, with low but present “specific” signal.
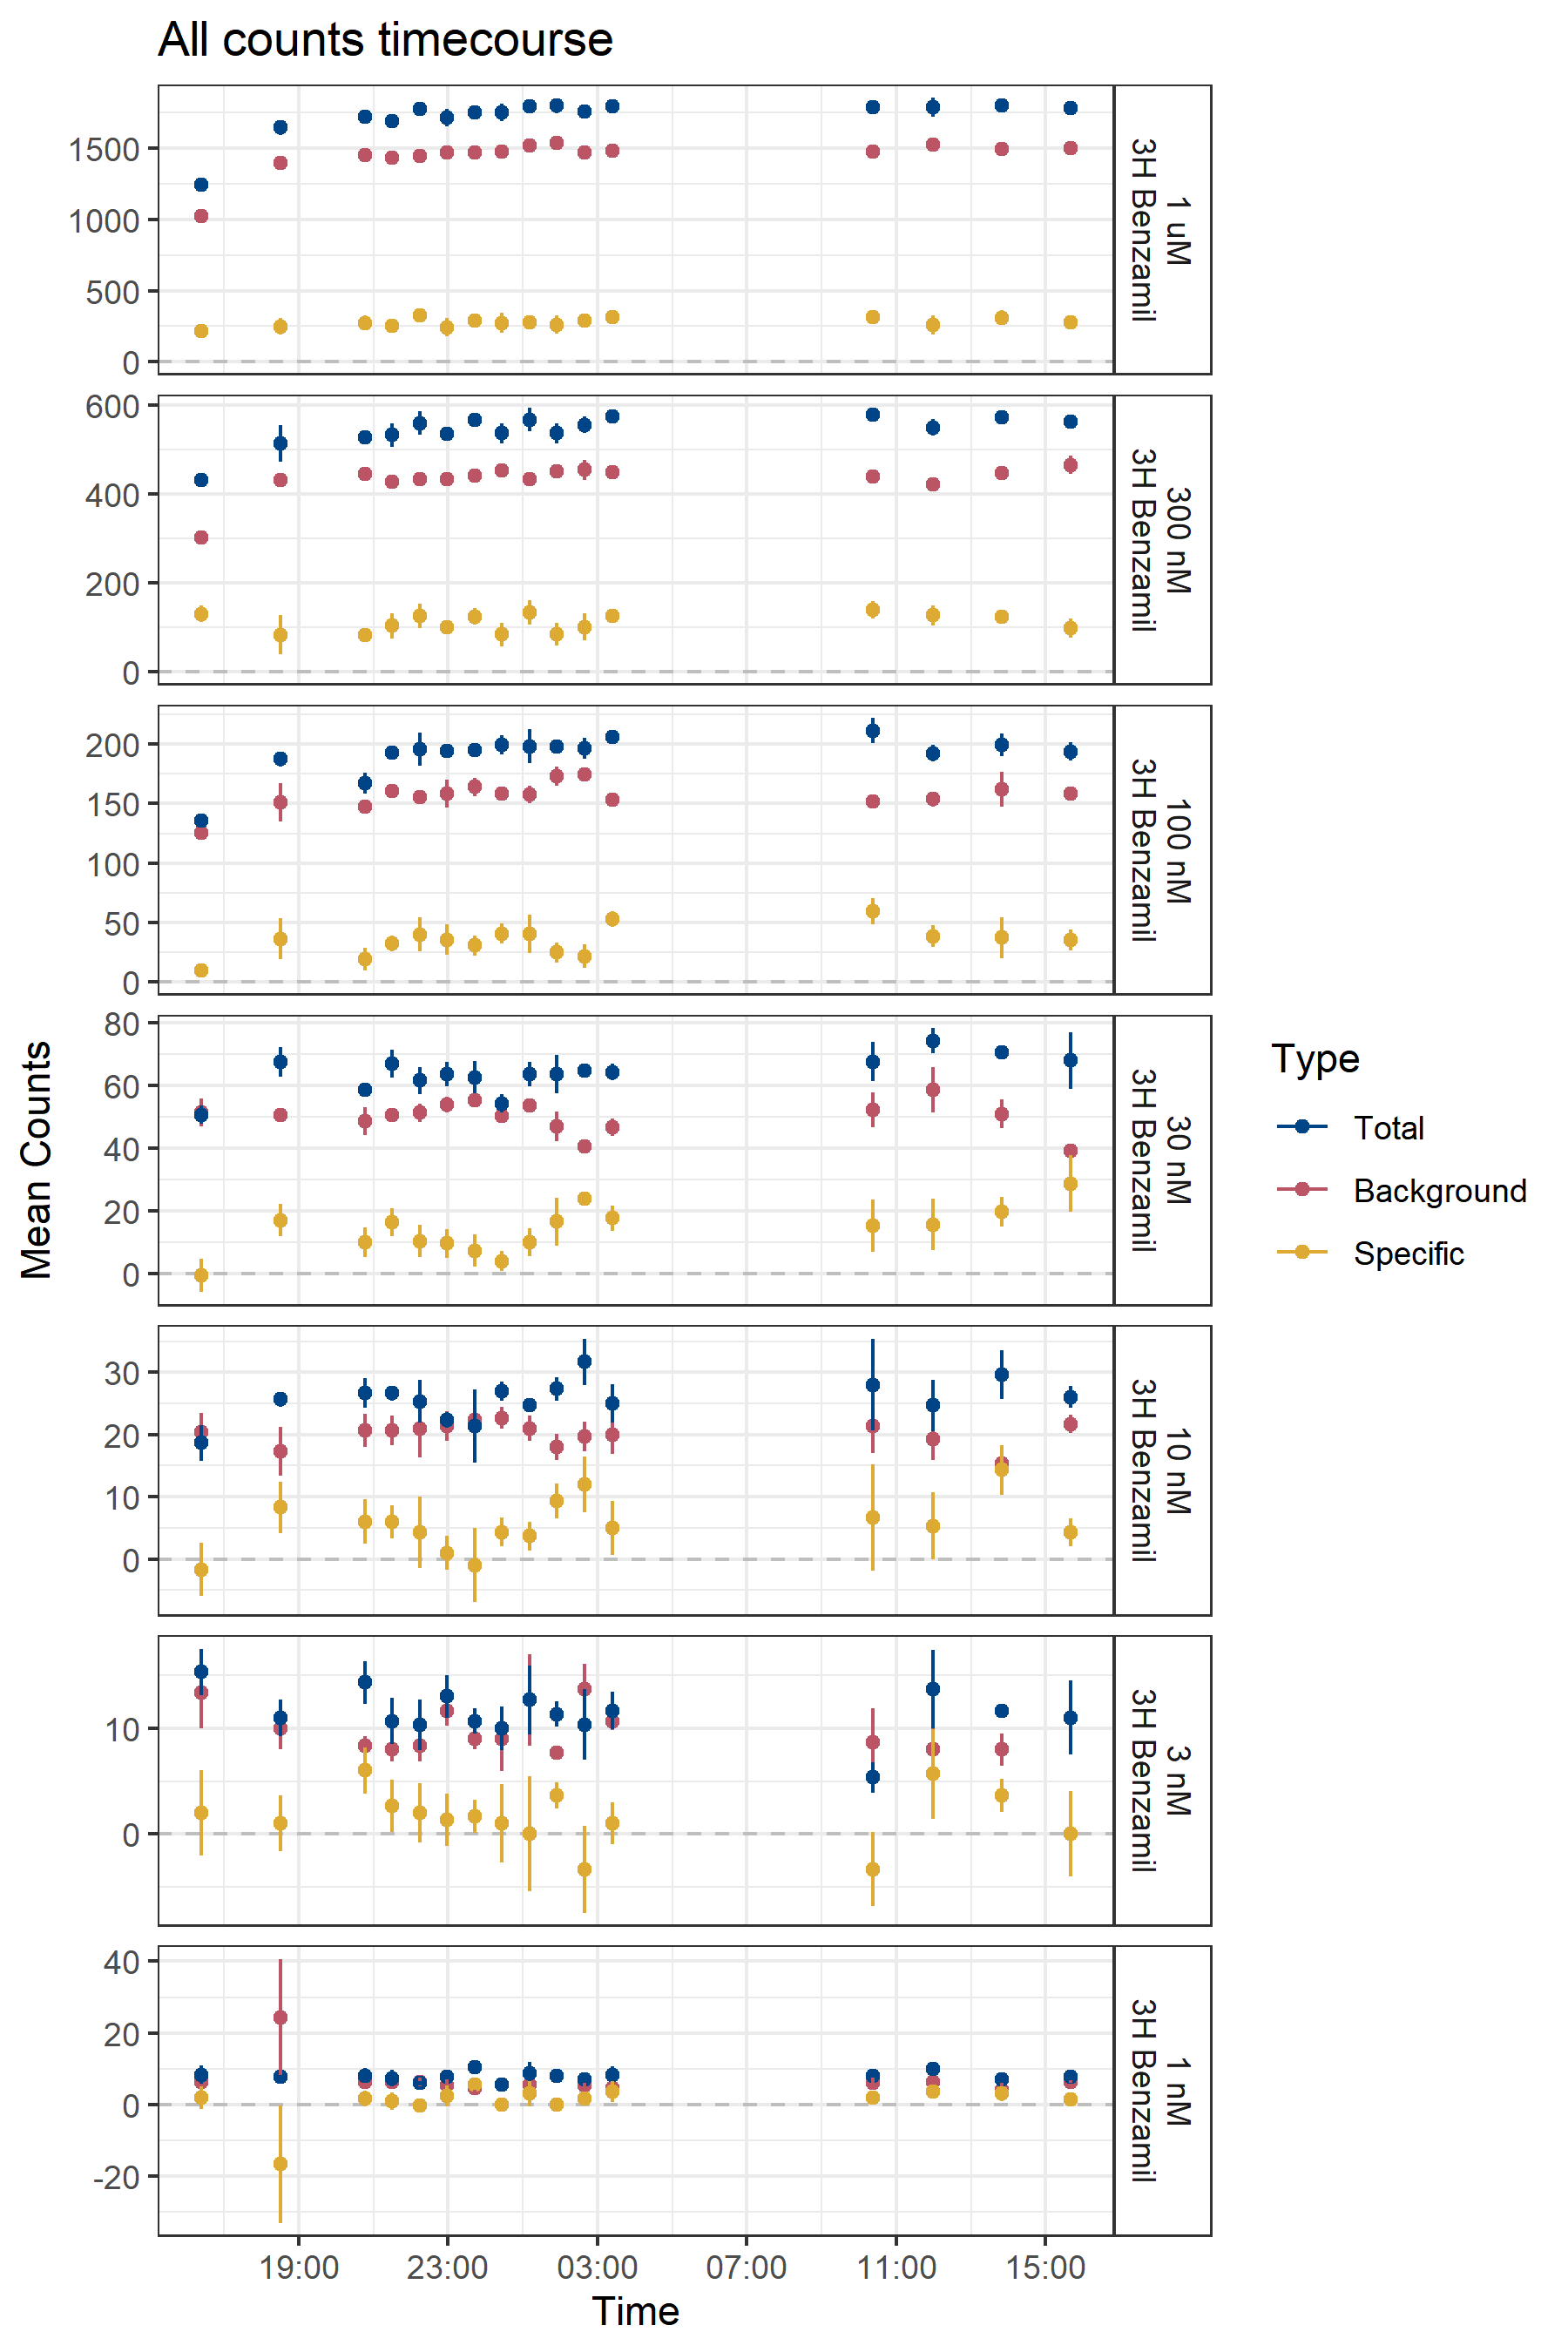
Along this line, addition of ENaC nanodiscs to the nanoSPA bead mixture does not elicit any increase in counts, or even any noticeable difference from the ENaC-less experiment (Figure B.11).
B.2.5 What should be done?
In my opinion, nothing. This assay is a dead end, or at least requires much more work than the more promising flux assay.
I personally also would like to note that, despite how it is used in several labs at OHSU, SPA is fundamentally a binding assay. It does not provide any information about whether an ion channel is capable of passing currents, let alone the specificity of those currents. As such, it is not truly a functional assay. Spending more time working on an assay that doesn’t even tell us what we need to know seems like a lose-lose to me.