Appendix D — Map Validation
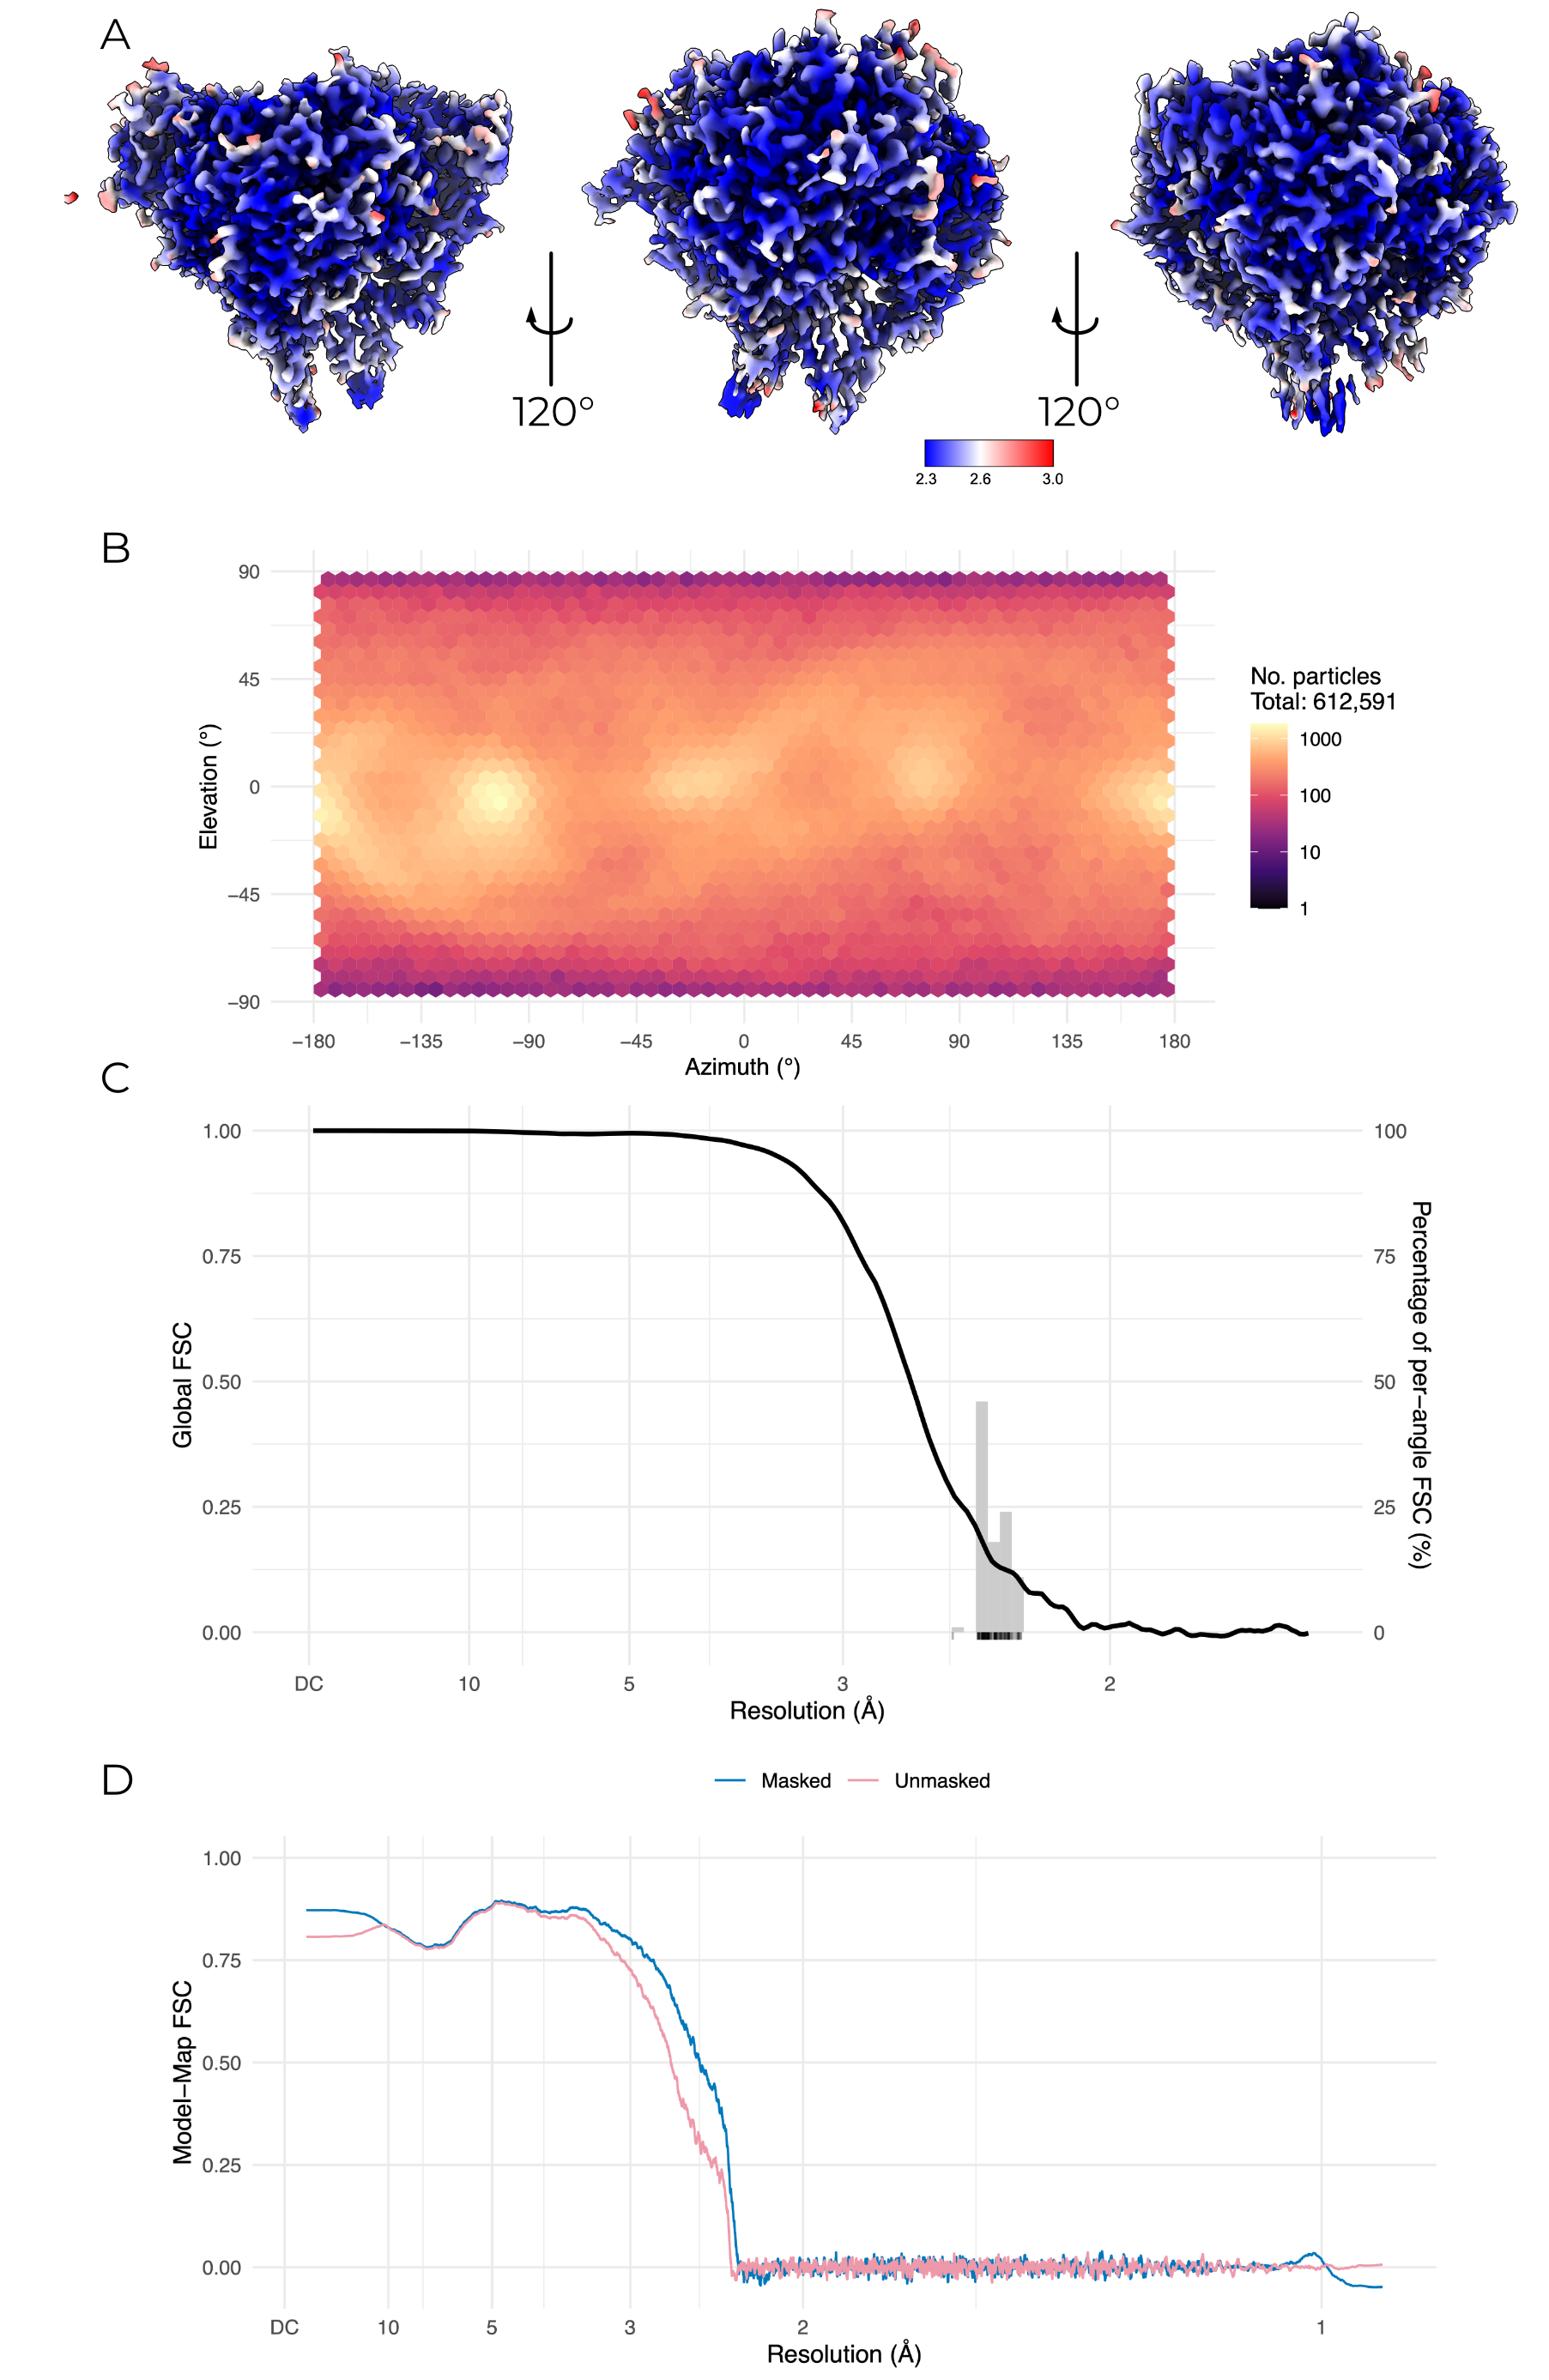
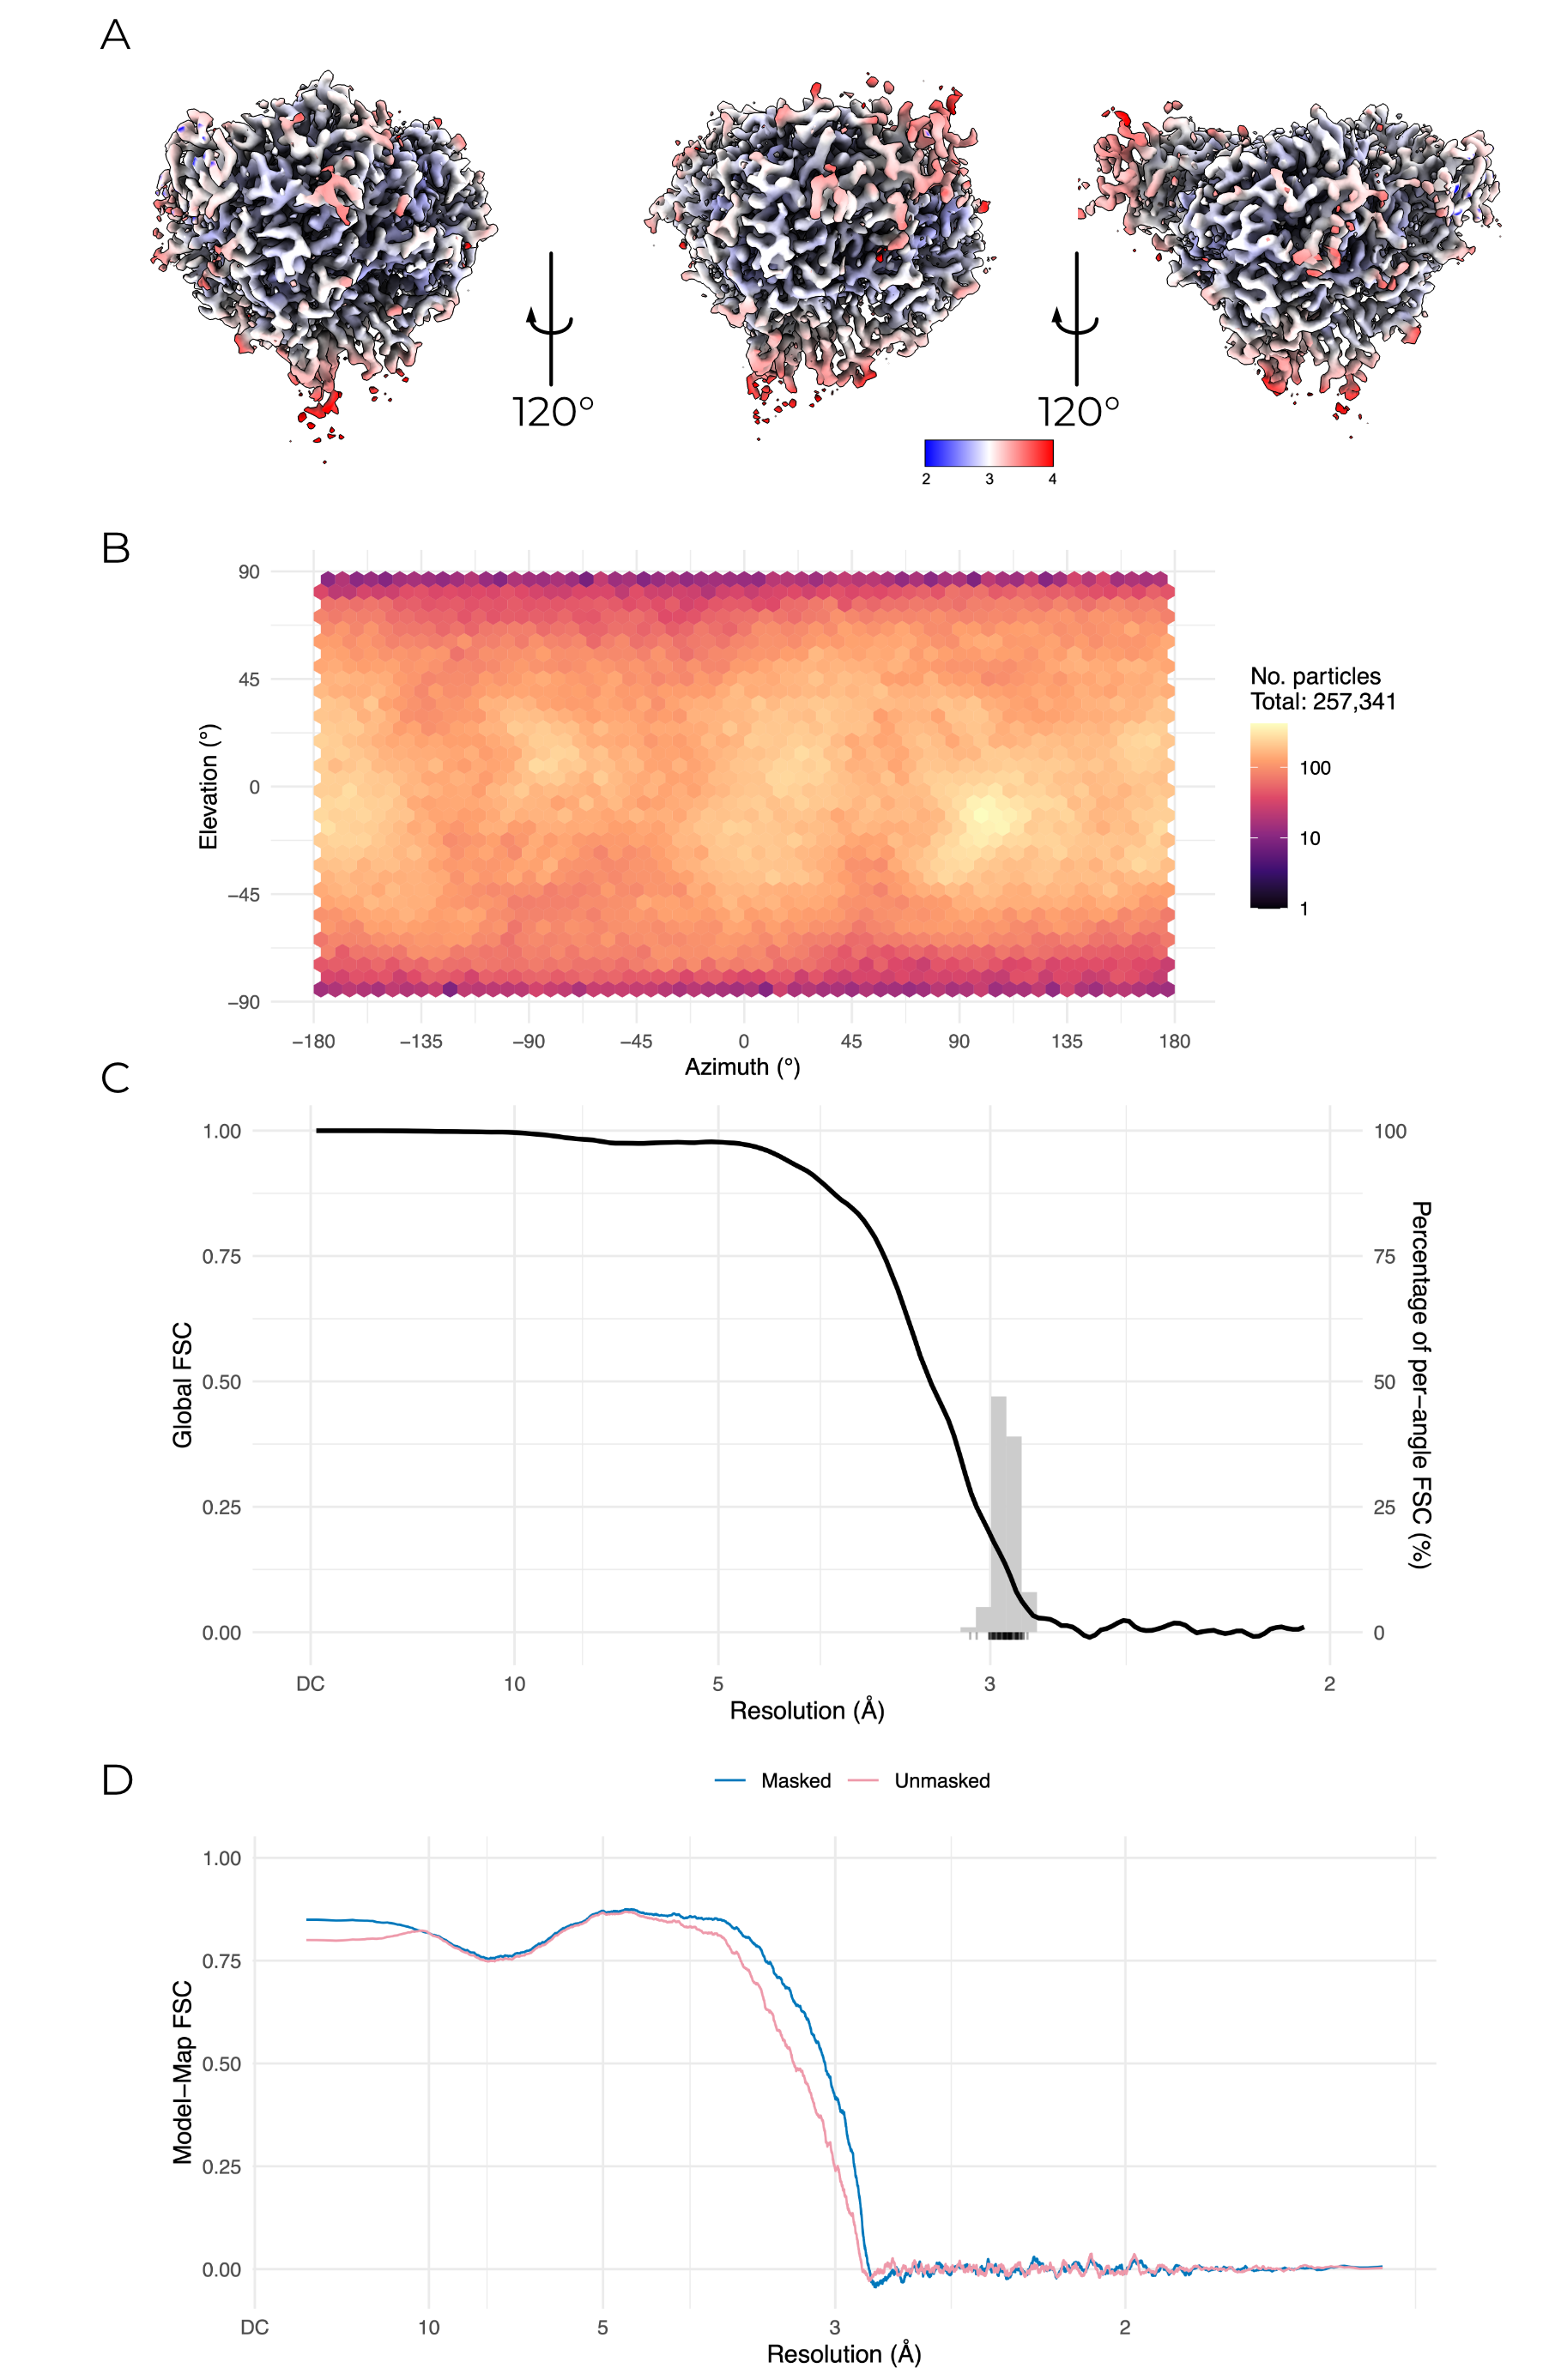
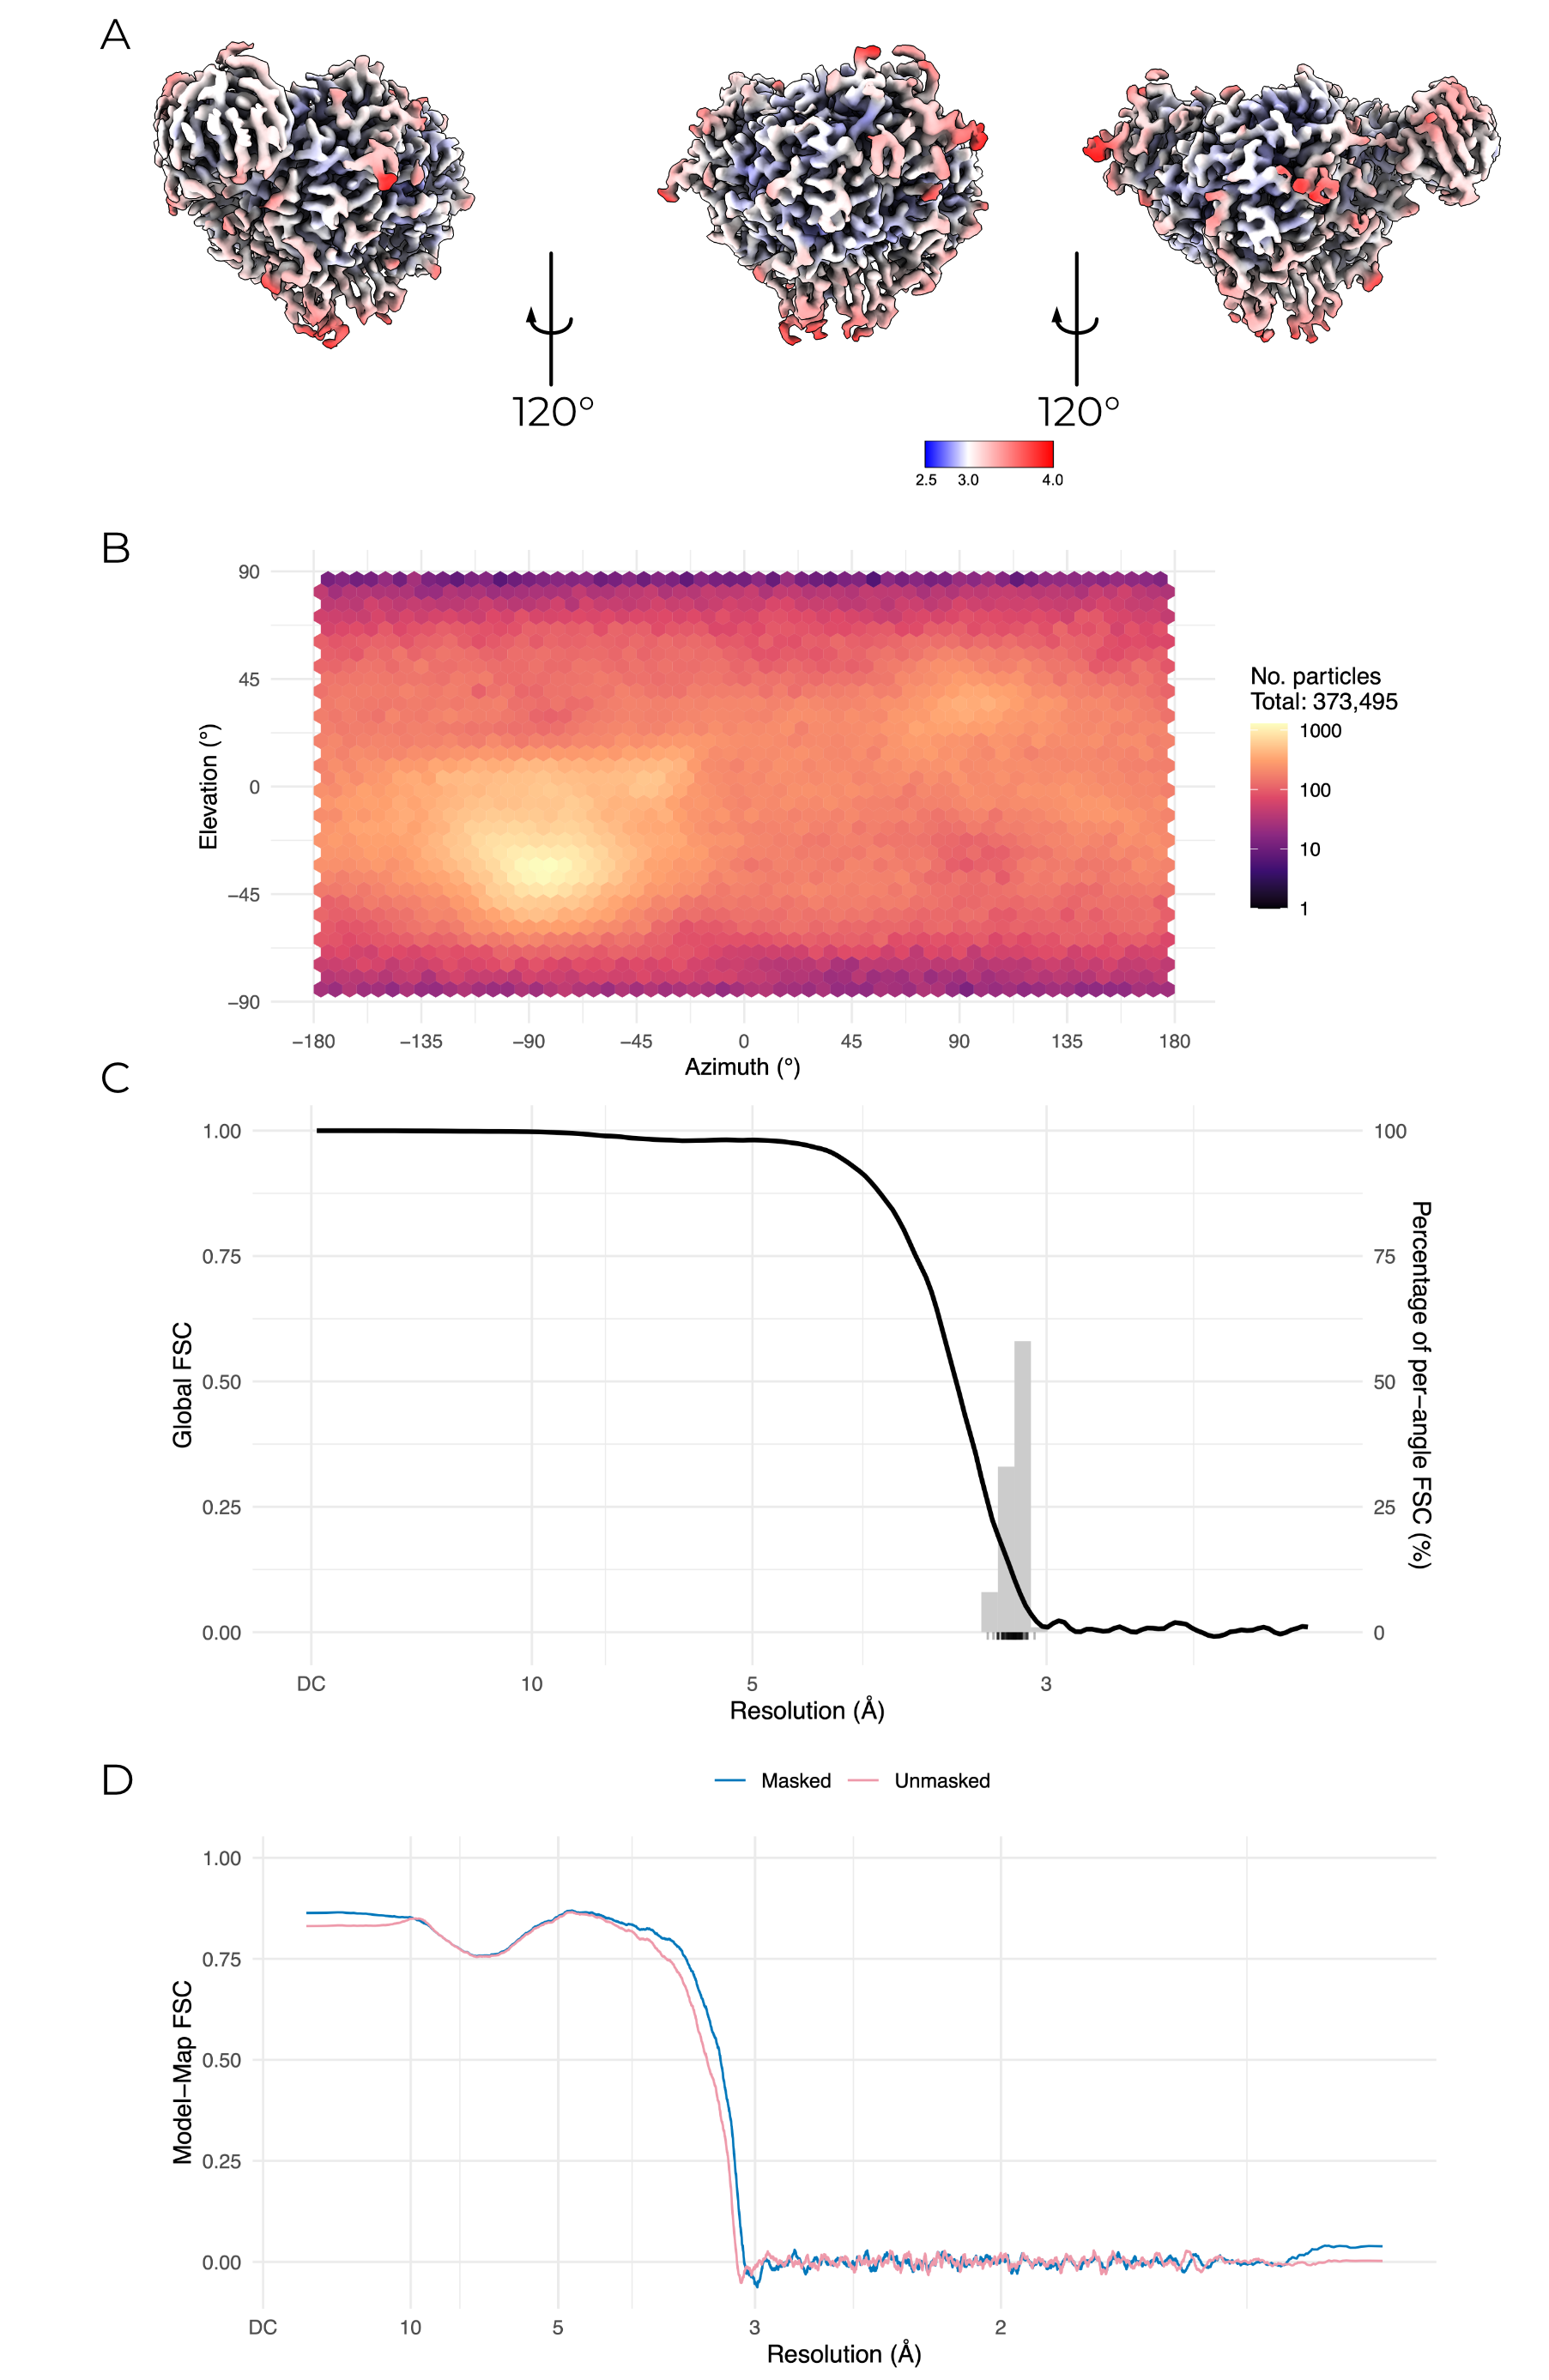
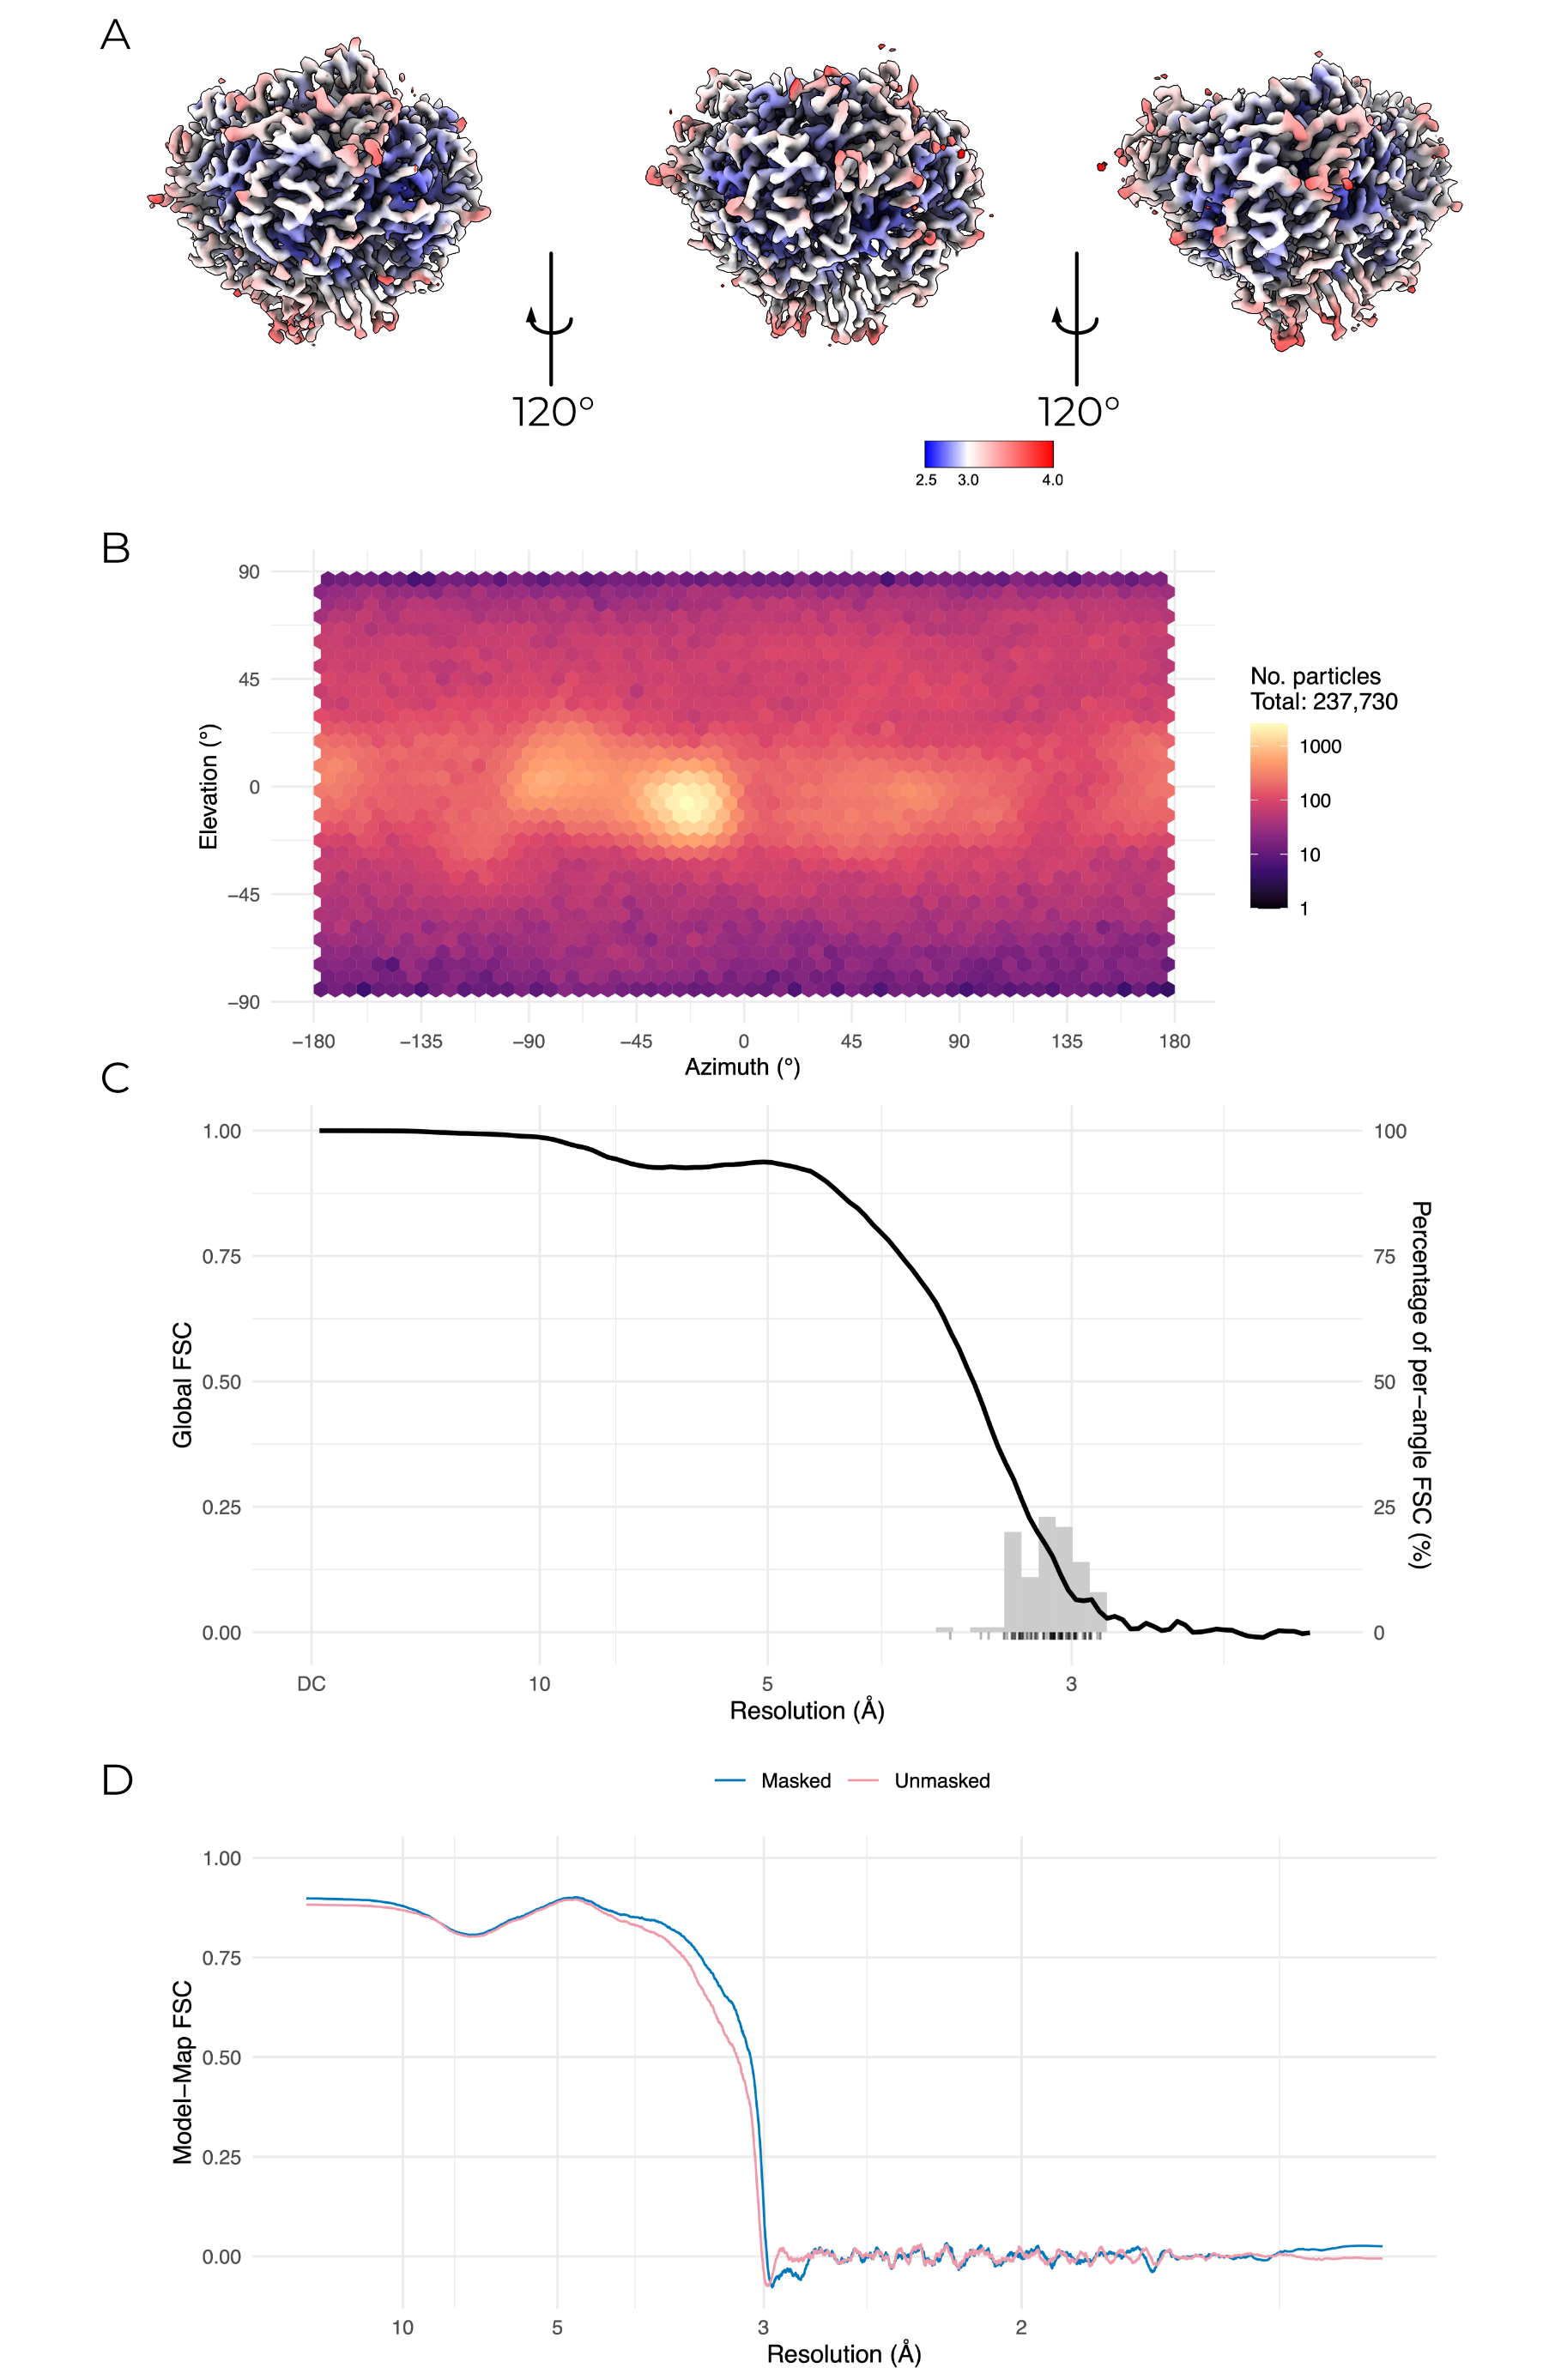
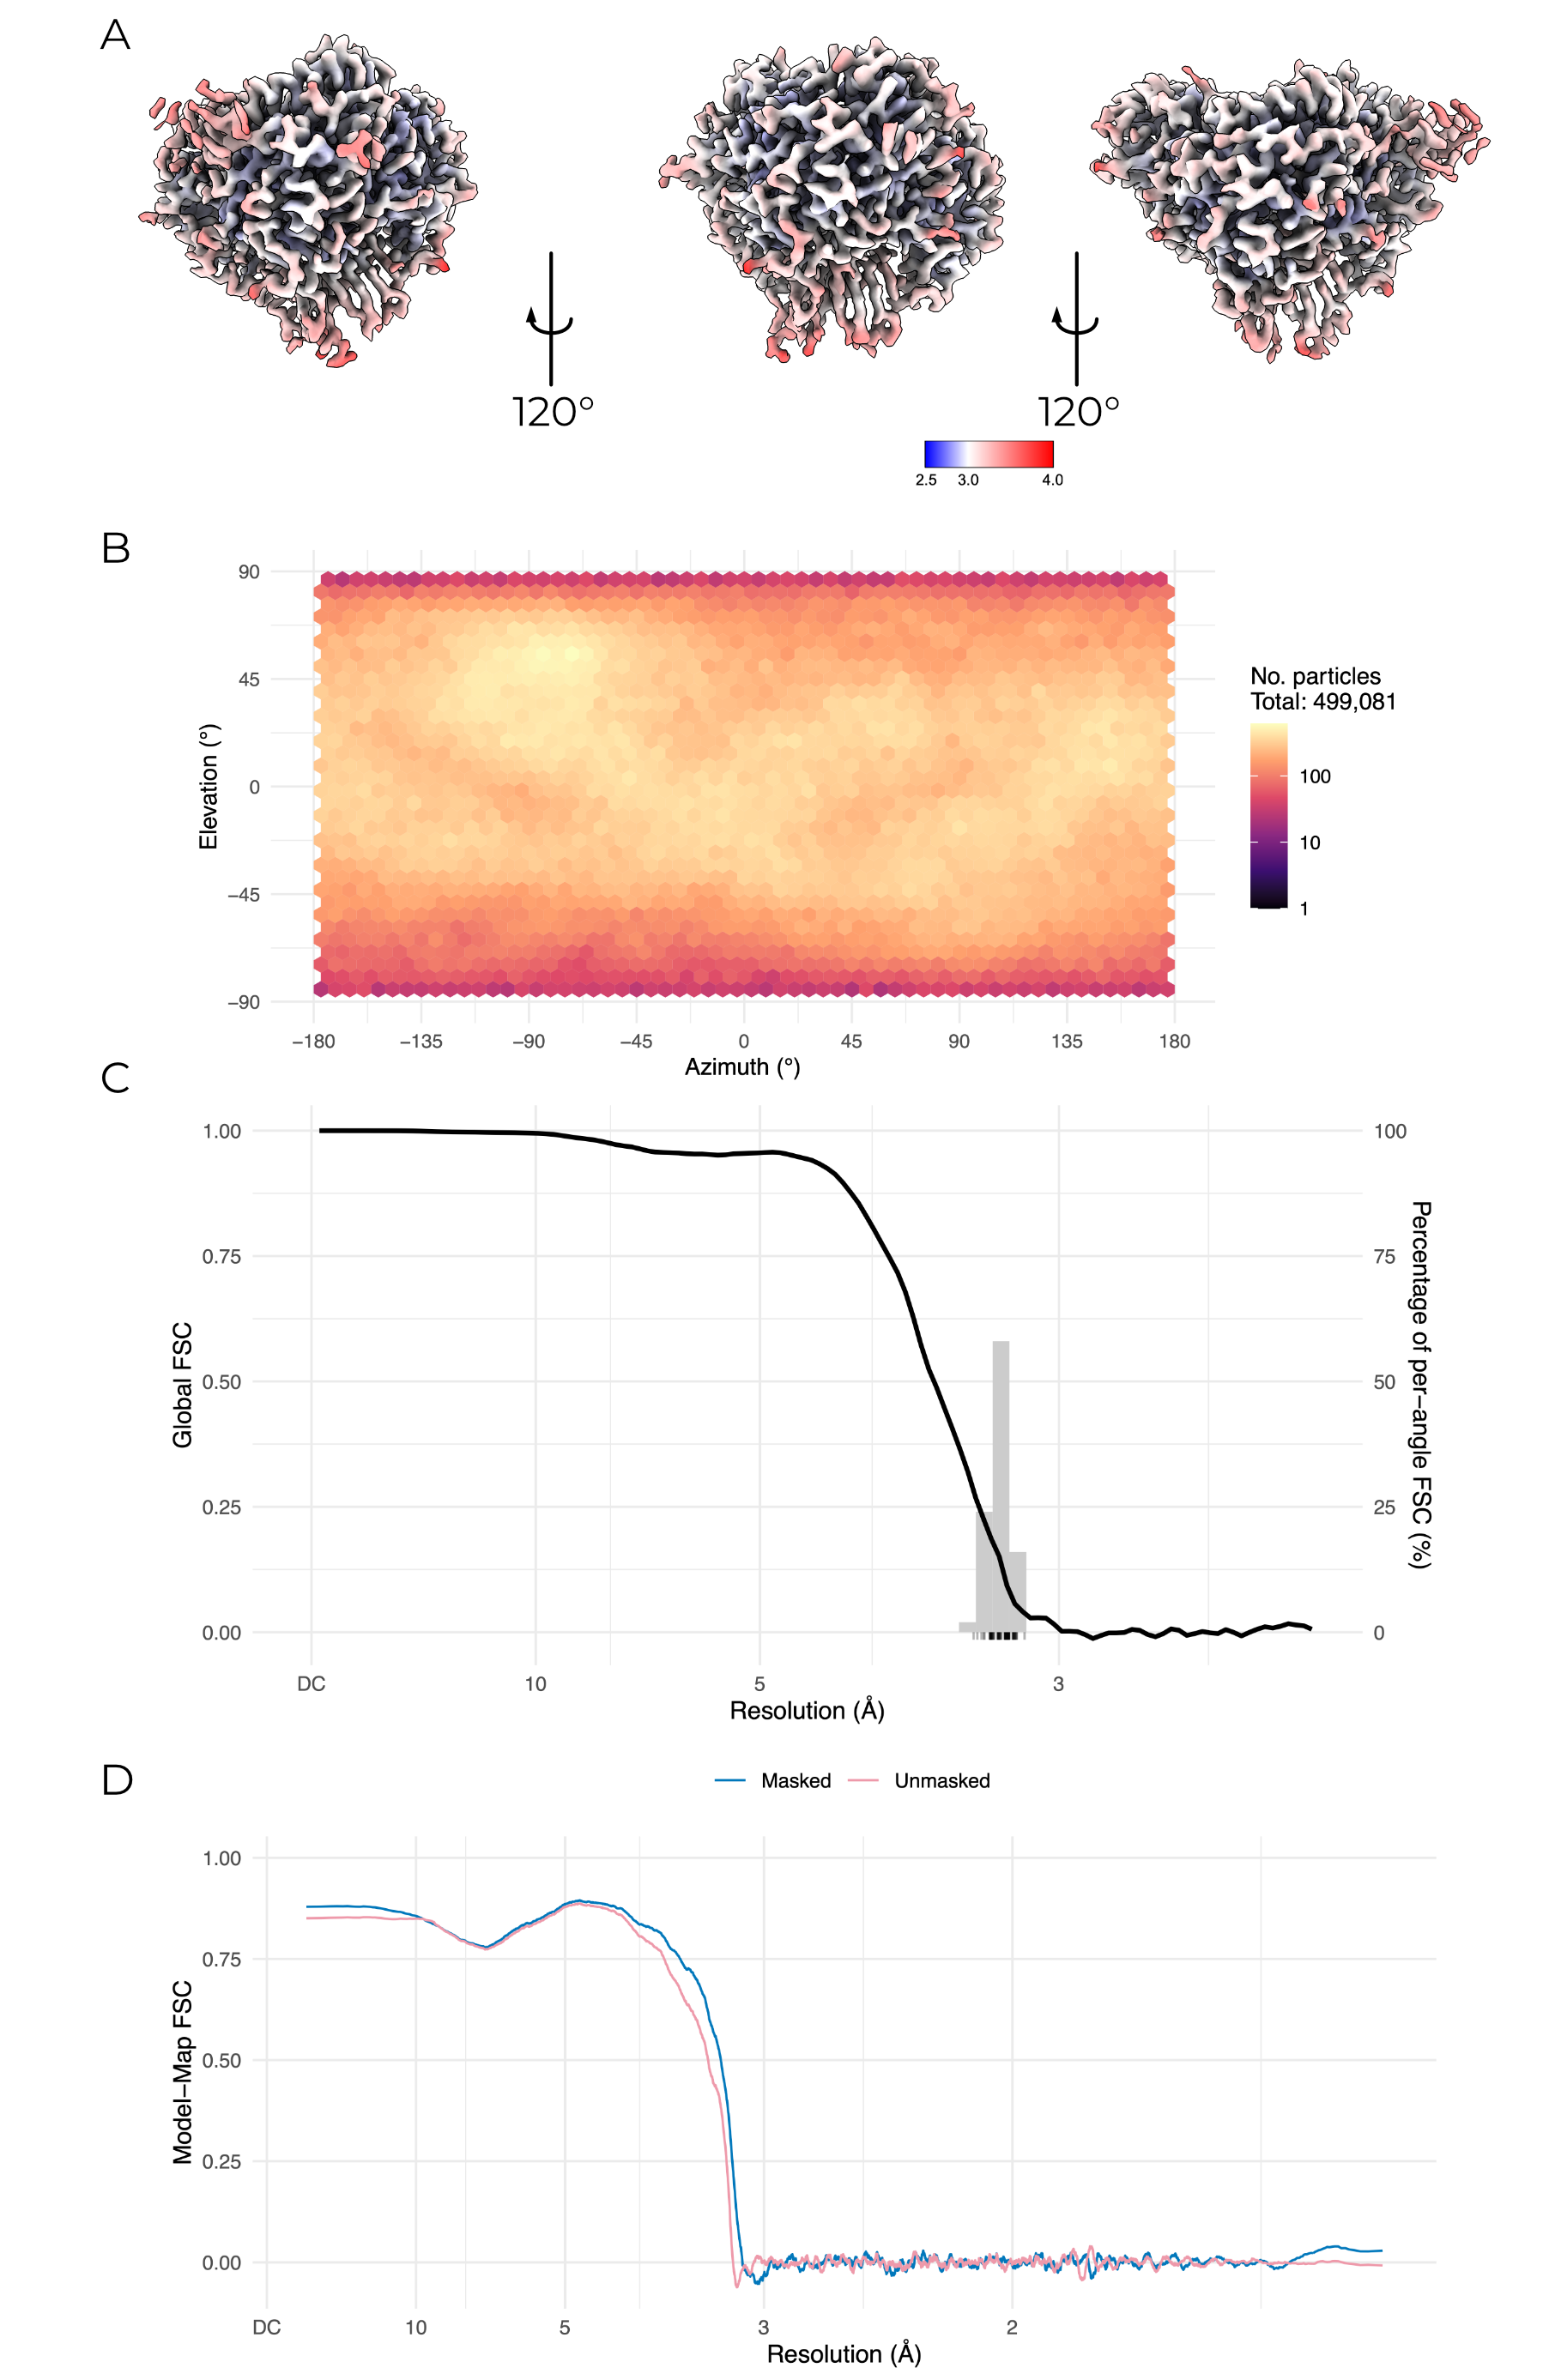
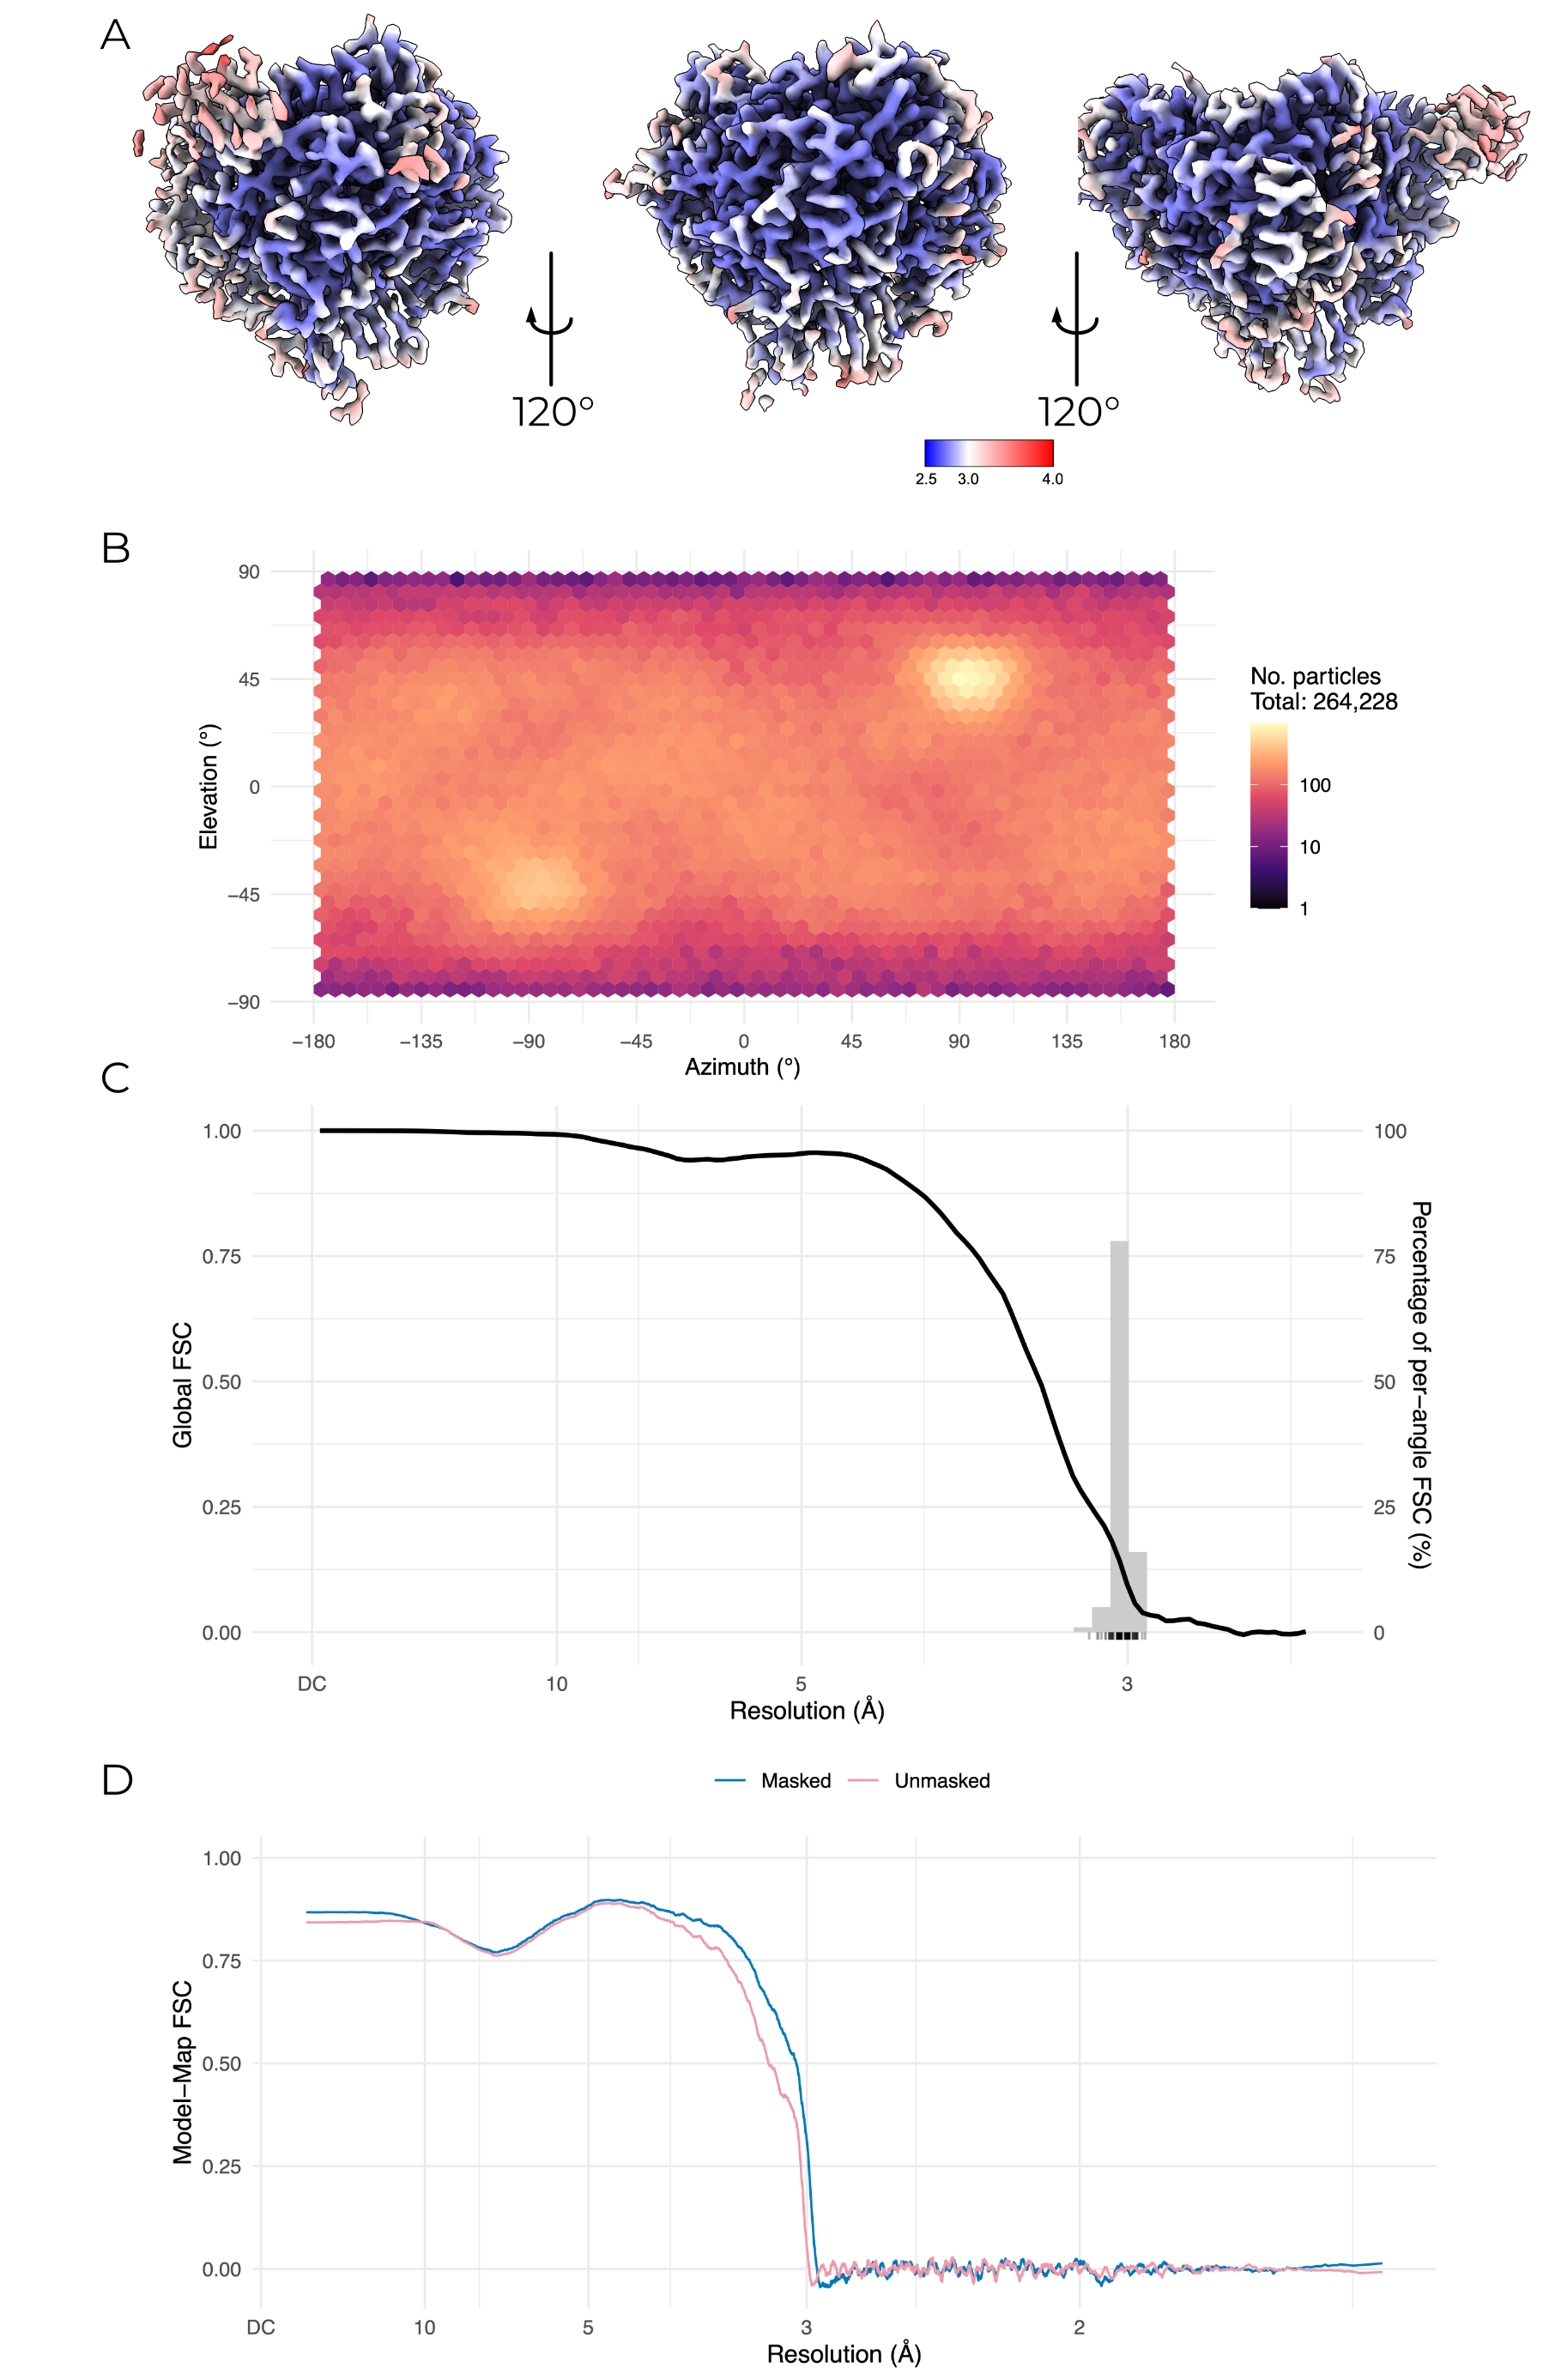
These figures present validation of my 3D models. In each, panel A is a local resolution estimation for the α, β, and γ subunits moving from left to right. The color scales for this panel vary slightly in an attempt to capture the resolution range of each map. Panel B is a particle orientation distribution plot. Note that in this panel the color scheme is logarithmic. Panel C is a global and 3DFSC plot. The global FSC is plotted in black, while the histogram of directional FSCs are plotted as a grey histogram. The exact values of the histogram are presented below the histogram as black marks, jittered slightly to give a sense of overlap. Finally, panel D is the model-map FSC.